
Bitcoin (BTC/USD) Market Holds Close to Returning Bearish Trend
Bitcoin Price Prediction – September 11
It now appears that the BTC/USD market holds close to returning into a bearish trend as the crypto’s price trades off northward below its bullish channel trend-lines drew. The trading activity of the crypto economy is trading around the level of $45,940 at a relatively increased rate of 1.52 percent. That implies that some degrees of slight pull-ups also play along since the recent last downward forces occurred.
BTC/USD Market
Key Levels:
Resistance levels: $47,500, $50,000, $52,500
Support levels: $42,500, $40,000, $37,500
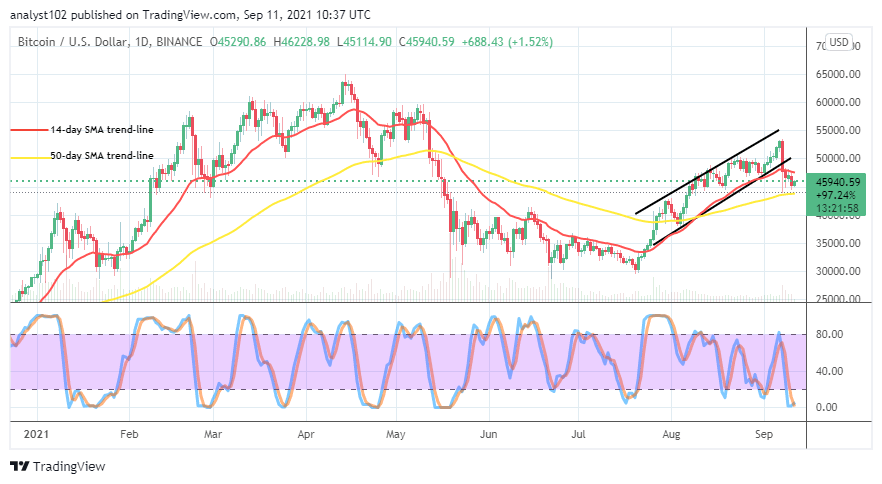
BTC/USD – Daily Chart
The BTC/USD daily chart reveals that the crypto market holds positions close to returning bearish trends. There has been a partial-downward path, featuring down below the bullish channel trend lines and the trend-line of the smaller SMA. The 50-day SMA indicator is underneath the 14-day SMA indicator and, it had, during the last downward depression motion that emerged on the September 7th session, almost touched. The Stochastic Oscillators have freshly dipped into the oversold region, touching a critical line around zero range. That suggests the downward-depression weight is on the scale of getting reduction gradually.
As the BTC/USD) Market Holds Close to Returning Bearish Trend, does the market have lost the momentum?
It is agreed upon that the crypto economy has down to one of the lower psychological trading zones at a $45,000 high area that the bigger SMA plays a supportive role to it. It observed that the BTC/USD market holds close to returning bearish trends based on the outcome of the following price action around the value line mentioned earlier. However, the expectation is that bulls can regain energy around that same point.
The breaking of the $45,000 line may potentially plunge the crypto market back into a downward trend. The consolidation movement of price around that value line could aid the probability that the BTC/USD trade gets further downsizings in the long run. Meanwhile, the readings of the Stochastic Oscillators, having touched the zero range line in the oversold trading region freshly, suggests that bears needed to be very cautious of their position entries.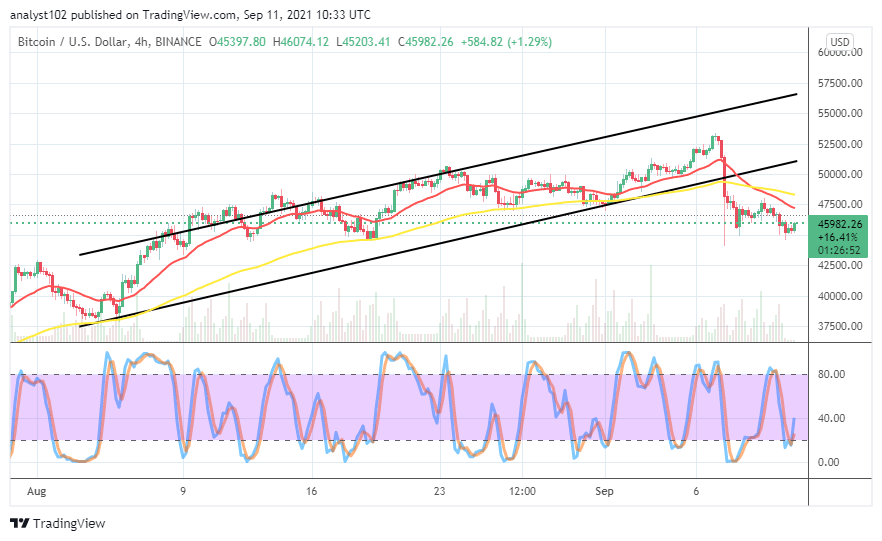
BTC/USD 4-hour Chart
The BTC/USD medium-term chart also reveals that the market holds close to returning bearish trends. During September 8th trading time, price strived to swing northward but, on the following day, resisted around $47,500, making it fall southward slightly below $50,000. The 50-day SMA indicator is over the 14-day SMA indicator underneath the bullish channel trend lines drew. The Stochastic Oscillators have crossed the lines briefly northbound from range 20 to the range of 40. That suggests that there is a signal promising that the subsequent price movements will be to the upside.
Looking to buy or trade Bitcoin (BTC) now? Invest at eToro!
67% of retail investor accounts lose money when trading CFDs with this provider.
Read more:


