
Bitcoin Price Prediction: BTC/USD Stabilizes Above $45,000
Bitcoin Price Prediction – September 11
The Bitcoin price prediction reveals that BTC is working hard to nurture a bullish trend from the support at $11,400.
BTC/USD Long-term Trend: Ranging (Daily Chart)
Key levels:
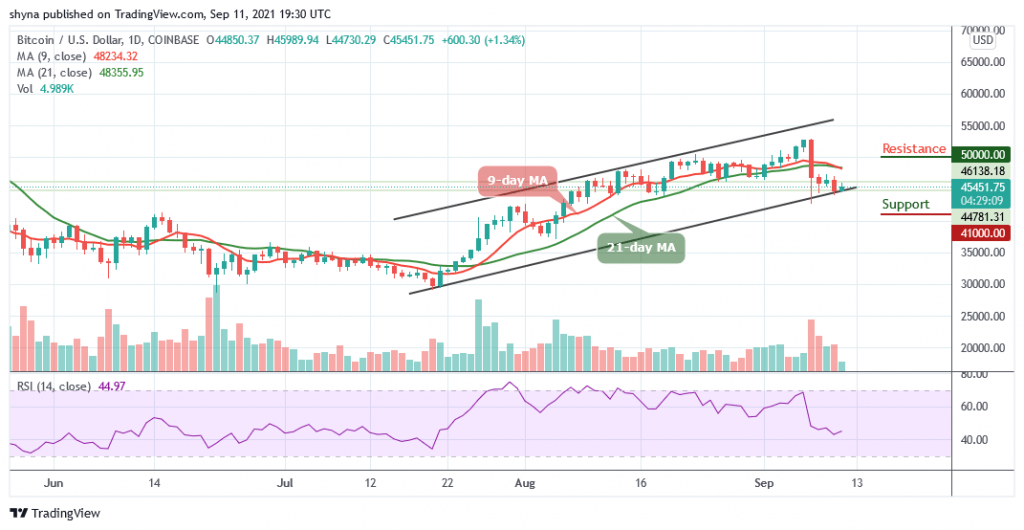
Resistance Levels: $50,000, $52,000, $54,000
Support Levels: $41,000, $39,000, $37,000
BTC/USD is currently trading 1.34% higher on the day. BTC/USD opens the session at $44,850 and now adjusting upwards to the prevailing market value of $45,451. However, the current conditions imply that the price may break above the 9-day and 21-day moving averages. Meanwhile, the technical indicator Relative Strength index may start following the upward trend.
Bitcoin Price Prediction: BTC Price May Create a New High
At the time of writing, the Bitcoin price is currently hovering at $45,451. Meanwhile, looking at the market movement, there is likely that the market may experience a quick retracement or sell-off just after touching the crucial $46,000, and traders may see $40,000 being tested again before pushing higher.
On the downside, if the market decides to fall, the price of Bitcoin could fall below the lower boundary of the channel, and if that support fails to hold the sell-off, traders could see a further decline towards the support levels of $41,000, $39,000, and critically $37,000. All the same, any further bullish movement above the 9-day and 21-day moving averages may hit the resistance levels at $50,000, $52,000, and $54,000.
BTC/USD Medium – Term Trend: Ranging (4H Chart)
On the 4-hour chart, we expect the coin to gain the lost momentum and hit the trade above $46,000. However, the volatility hovers, and the selling pressure still exists which leads the coin not to be able to cross above the 9-day and 21-day moving averages. Meanwhile, the $42,000 and below may come into play if BTC breaks below the lower boundary of the channel.
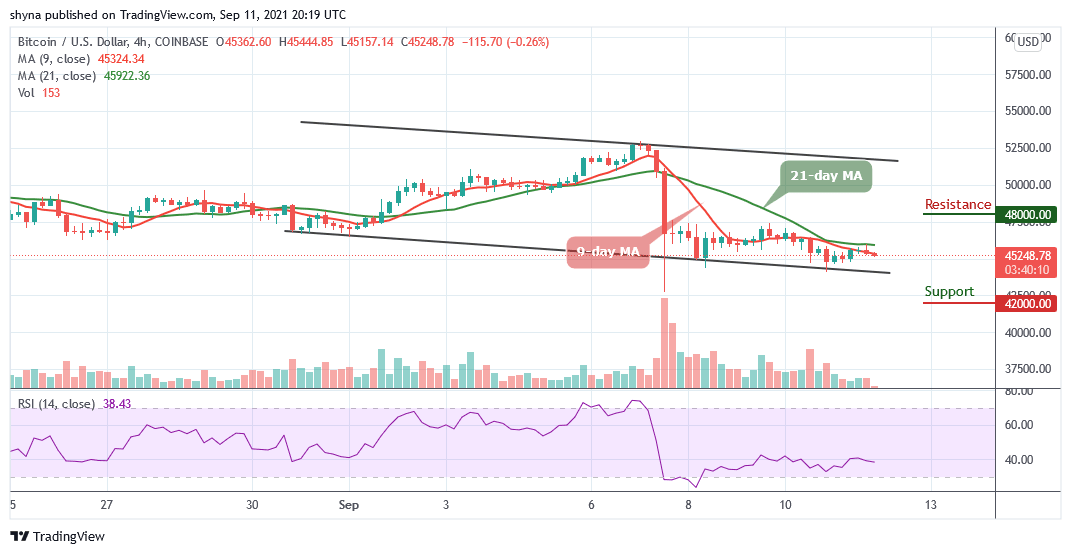
However, if the buyers can reinforce and power the market, traders can expect a cross above the moving averages, and breaking this barrier may further allow the bulls to reach $48,000 and above. Meanwhile, the technical indicator Relative Strength Index (14) is seen moving below 40-level which shows that more bearish signals may play out.
Looking to buy or trade Bitcoin (BTC) now? Invest at eToro!
67% of retail investor accounts lose money when trading CFDs with this provider
Read more:


