
Bitcoin Price Prediction: BTC/USD Trades Below $45,000
Bitcoin Price Prediction – September 13
The Bitcoin price is following a 3.91% price decline over the past 24 hours as the cryptocurrency fails at $46,900 and heads lower.
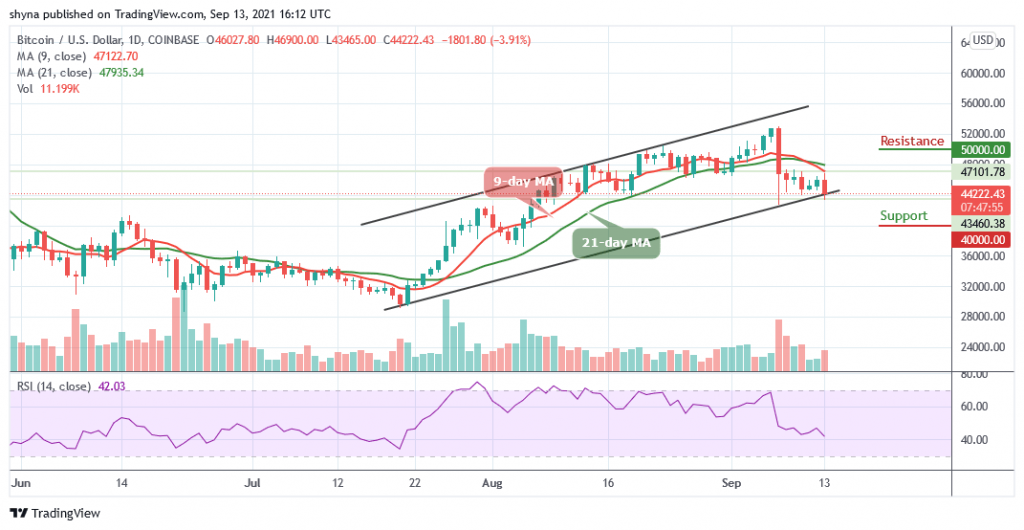
BTC/USD Long-term Trend: Ranging (Daily Chart)
Key levels:
Resistance Levels: $50,000, $52,000, $54,000
Support Levels: $40,000, $38,000, $36,000
BTC/USD loses its momentum after touching key resistance above $46,900. As of writing, the king coin is down 3.91% on the day at $44,222 trading around the lower boundary of the channel. Meanwhile, looking at the daily chart, Bitcoin is struggling to close above $44,000 and once it does this, it should be free to rise well above $45,000 in the next positive direction.
Bitcoin Price Prediction: Bitcoin (BTC) Gets Ready for the Downside
According to the daily chart, the Bitcoin price is not likely to close above the resistance level of $47,000. The coin has really been struggling to break this region over the past 5-days of trading. However, in today’s session, the coin attempted to push higher as it reaches $46,900, but the sellers then stepped in and push the coin lower to reach the current level at $44,222.
Nevertheless, $42,000 serves as the nearest support level, which may likely make room for the coin to fall further with the next critical supports at $40,000, $38,000, and $36,000. The technical indicator Relative Strength Index (14) is moving to cross below 40-level to indicate a downtrend movement. On the contrary, BTC/USD may likely see the resistance levels of $50,000, $52,000, and $54,000 if it crosses above the 9-day and 21-day moving averages.
BTC/USD Medium-Term Trend: Ranging (4H Chart)
On the 4-Hour chart, the Bitcoin price is hovering around $44,453 and may take time to persistently trade above $45,000. Moreover, if the bulls gather enough strength and regroup, the upward movement may be able to near the $50,000 and $52,000 resistance level.
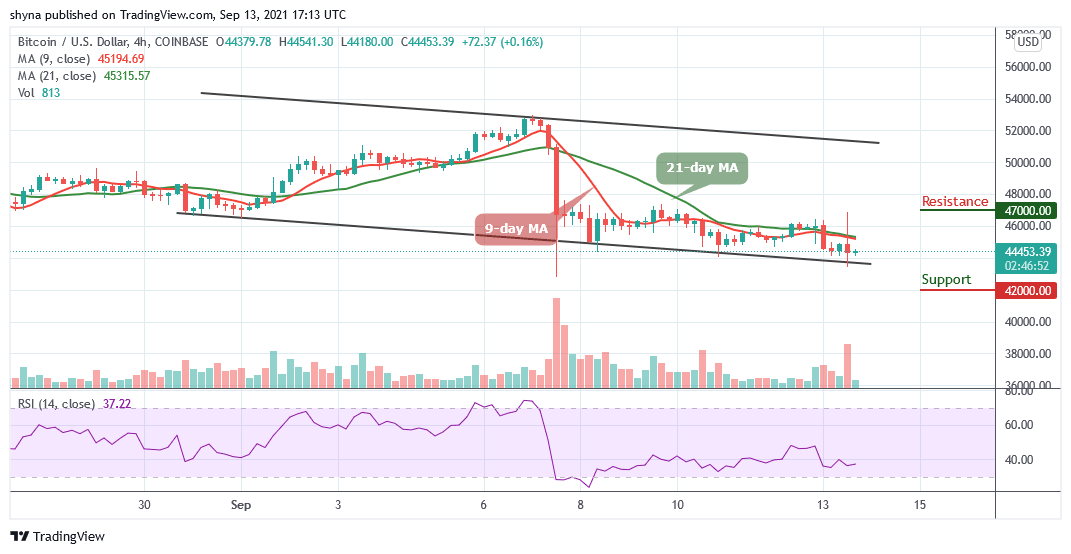
Looking at the downside, if the price crosses below the lower boundary of the channel, immediate support is likely to be found around the $42,000 level. However, the price may likely fall below $41,500 if the bears pump enough pressure into the market, therefore, a further movement could reach the critical support at the $40,000 level and below. On the other hand, Bitcoin (BTC) is currently moving in sideways as the technical indicator Relative Strength Index (14) moves below 40-level, indicating an indecisive market movement.
Looking to buy or trade Bitcoin (BTC) now? Invest at eToro!
67% of retail investor accounts lose money when trading CFDs with this provider
Read more:


