
Bitcoin (BTC) Price Prediction: BTC/USD Breaches More Supply Zones as Bulls Gain More Grounds
Bitcoin Rallies Above $66,000 as Bulls Gain More Grounds – October 20, 2021
Yesterday,
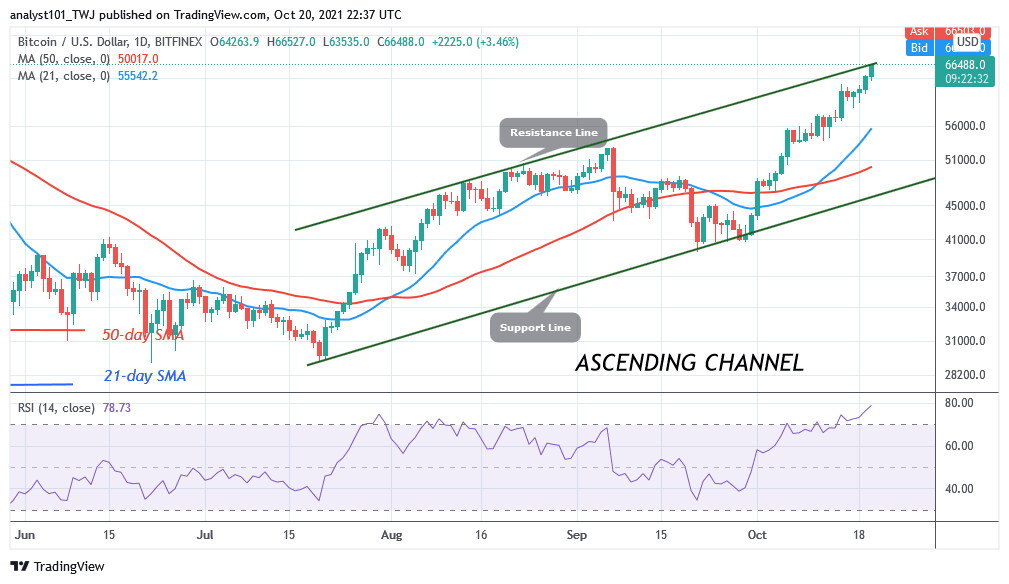
On October 19, buyers succeeded in pushing the BTC price above the $62,900 resistance zone. The cryptocurrency rallied to attain a new high of $64,500. The $64,500 price level is the historical price level of April 2021. Today, Bitcoin is retesting the historical price level to sustain itself above it. In April, buyers could not breach the historical price level after three attempts at the resistance. Bitcoin plunged to $30,500 low as bulls bought the dips. Today, Bitcoin has risen above the $60,000 psychological level. For the past 48 hours, BTC’s price has been fluctuating below the $64,500 resistance zone and above the $63,000 support. The upside momentum will resume when buyers sustain the crypto above the resistance zone. BTC price is at level 74 of the Relative Strength period 14. BTC/USD is trading in the overbought region of the market.
Bitcoin Adoption Won’t Affect IMF Discussions, Says Douglas Rodriguez
Douglas Rodriguez is the president of the Central Reserve Bank of El Salvador. In a Bloomberg interview, Rodriguez indicated that the adoption of Bitcoin as legal tender will not affect plans to secure a $1.3-billion loan facility from the International Monetary Fund (IMF). The central bank has described El Salvador’s Bitcoin law as only having “upside risks,” Rodriguez indicated that the BTC Bull Run could aid the country’s economy to expand by over 9% more than initial forecasts. Moreover, the central bank has explained to the IMF that “Bitcoin is simply a payment method.” Meanwhile, in El Salvador, Bitcoin acceptance has continued to grow with people selling more United States dollars to buy BTC. However, El Salvador’s credit rating has been affected over doubts by the IMF talks, and the recent BTC adoption as legal tender.
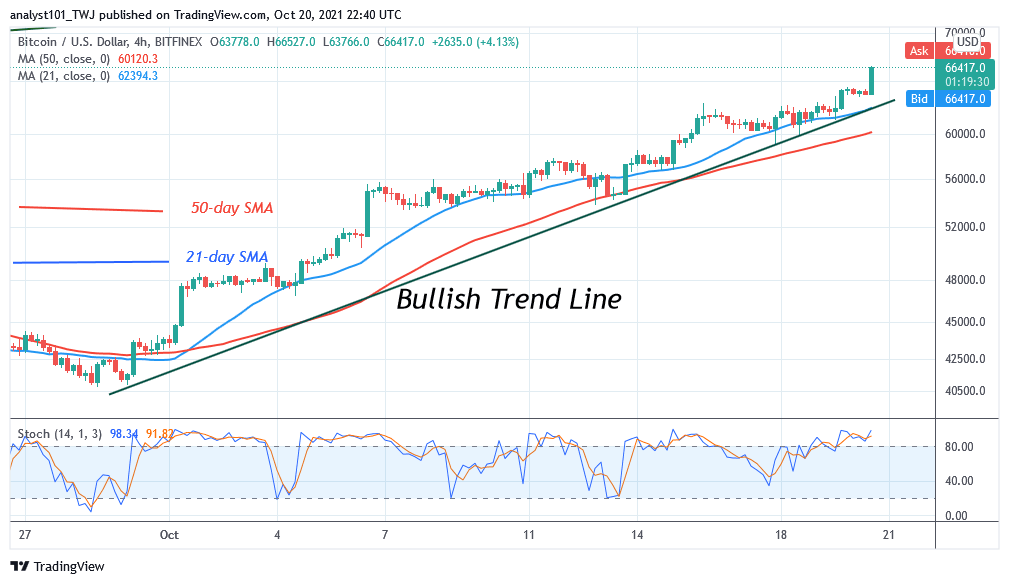
Meanwhile, buyers have broken above the $64,500 resistance zone as Bulls gain more grounds. The bulls have retested the resistance level thrice as Bitcoin rallies above $66,500. The 21-day moving average is providing support as Bitcoin continues its bullish run. The uptrend will continue to rise as long as the moving averages remain unbroken.
Looking to buy or trade Bitcoin (BTC) now? Invest at eToro!
67% of retail investor accounts lose money when trading CFDs with this provider
Read more:
• How to buy Bitcoin
• How to buy cryptocurrency


