
Bitcoin (BTC/USD) Market Swings Further High, Hitting $47,500
Bitcoin Price Prediction – March 29
The upward rallying motion recently embarked upon by the BTC/USD trade operations has led the price to one of the potential recovery points lost sometimes ago. In a more elaborative talk, the crypto-economic market currently swings further high as it hits the $47,500 resistance line. Price is trading around $47,346 at a minimal positive percentage rate of 0.43.
BTC/USD Market
Key Levels:
Resistance levels: $47,500, $50,000, $52,500
Support levels: $45,000, $42,500, $40,000
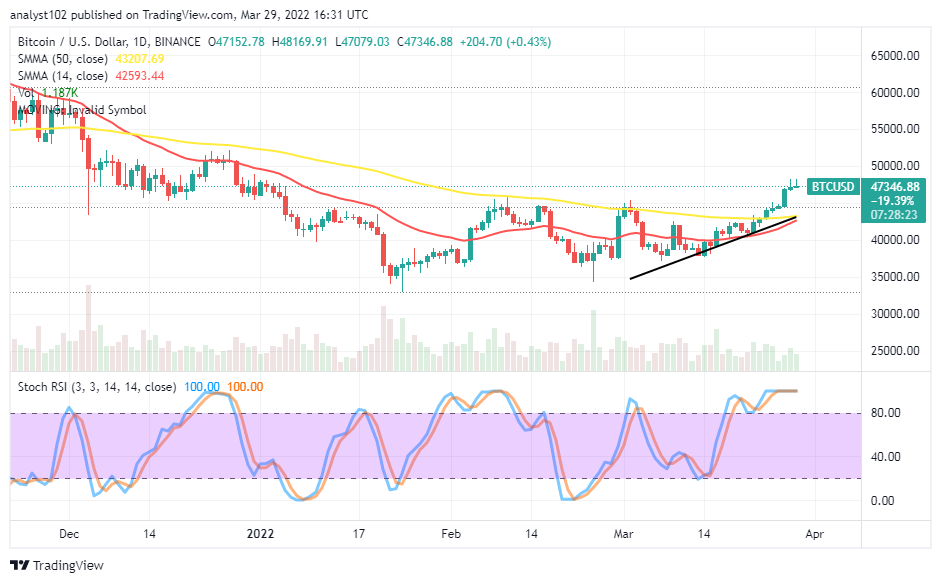
BTC/USD – Daily Chart
The BTC/USD daily chart reveals the crypto-economic market swings further high, hitting $47,500 resistance. And that accounts for the first time having a rebounding motion achieving such an increased volume since the year started to witness variant downing processes. The 14-day SMA has stretched northward closely beneath the 50-day SMA indicator. The Stochastic Oscillators are in the overbought region, moving in a consolidation manner to authenticate an upward force is in progress.
Has now been a tangible sign signaling against getting more sustainable ups in the BTC/USD trade operations as the market swings further high, hitting $47,500 resistance?
There has been no tangible sign signaling against getting more sustainable ups in the BTC/USD trade operations as the market swings further high to hit $47,500 resistance. Despite the situation dominated by bullish running, long-position takers should be wary of a fake breakout of resistance levels that have not been breached during the current pushes to the upside to avoid getting whipsawed in no time.
On the downside of the technical analysis, the BTC/USD market’s overbought trading outlook has only been enjoying a consolidation moving process that can in no time get exhausted. A line of price convergences at a higher resistant trading spot needed to form so that bears can have a good re-shaping of their positions toward taking shorting orders. But, they have to be patient for a while more.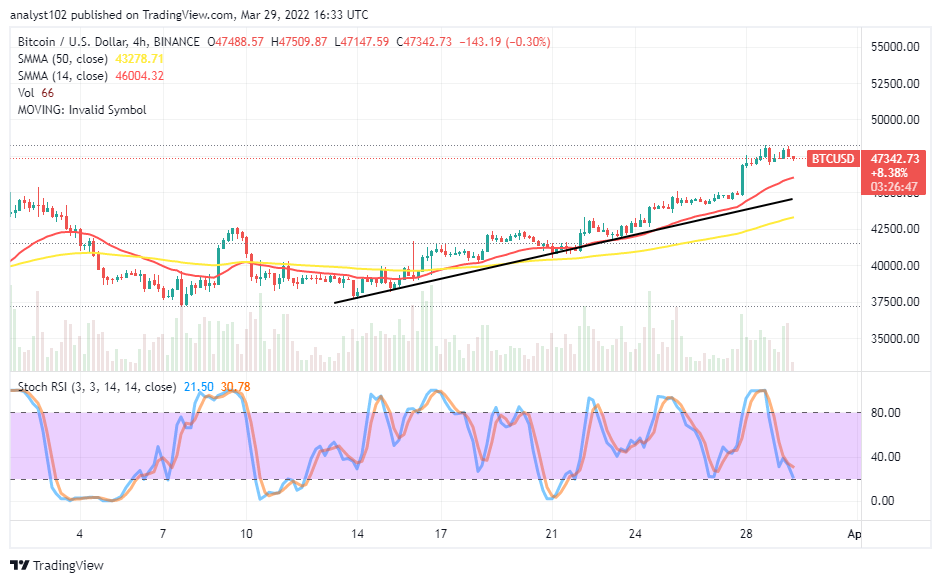
BTC/USD 4-hour Chart
The BTC/USD medium-term chart shows the crypto-economic market swings further to hit $47,500 resistance. The 14-day SMA trend line is above the 50-day SMA trend line. The bullish trend line northwardly drew back the trending outfit of the smaller SMA to the upside. The Stochastic Oscillators have moved southbound closely to the range of 20. If a fearful rebounding motion occurs around the value-line mentioned, the next higher resistance at $50,000 will target. A quick reversal may afterward surface against the presumed higher trading resistance level to allow bears to get a loophole for a sell order.
Looking to buy or trade Bitcoin (BTC) now? Invest at eToro!
68% of retail investor accounts lose money when trading CFDs with this provider.
Read more:


