
Bitcoin (BTC/USD) Price Downsizes, Approaching $45,000 Support
Bitcoin Price Prediction – December 30
There has been another round of downward motions in the BTC/USD market operations as the crypto’s price downsizes, approaching the $45,000 line. The market earlier witnessed a low of $45775. But, currently, the price trades around $46,986 at a rate of 0.62 percent in positive.
BTC/USD Market
Key Levels:
Resistance levels: $50,000, $52,500, $55,000
Support levels: $45,000, $42,500, $40,000
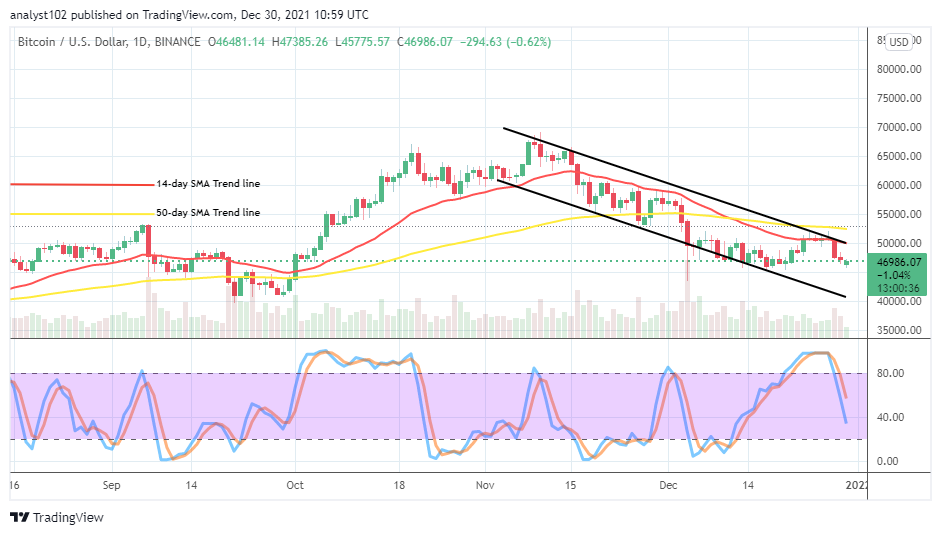
BTC/USD – Daily Chart
The BTC/USD daily chart exhibits that the crypto market’s price downsizes, approaching a $45,000 support level believed to be the critical baseline to the current downward forces. The 14-day SMA indicator is underneath the 50-day SMA indicator. The Stochastic Oscillators have briefly pushed southbound against the range of 40. And, a bullish candlestick is in the making to potentially signify that the US Dollar may soon be losing momentum on a gradual note.
Will the $45,000 breach sustainably as the BTC/USD price downsizes, approaching it in another round?
A fearful reversal of the current up swinging motions effort may lead the BTC/USD market’s journey back to a lower trading zone beneath the $45,000 as the crypto-economic price downsizes, approaching the support value line. In the light of that assumption playing out, price may resume a consolidation movement around the value line mentioned and the $42,500 for some time afterward.
On the downside of the technical analysis, indications still signify that a depressive force is yet to be over. Therefore, traders, especially buyers, needed to be wary of exerting a position. The positioning posture of the Stochastic Oscillators will give an insight as to when there’ll be a safer moment to observe the completion of a particular force. As a result, it would be technically ideal to wait for a change of direction in the trading tool before denoting an order.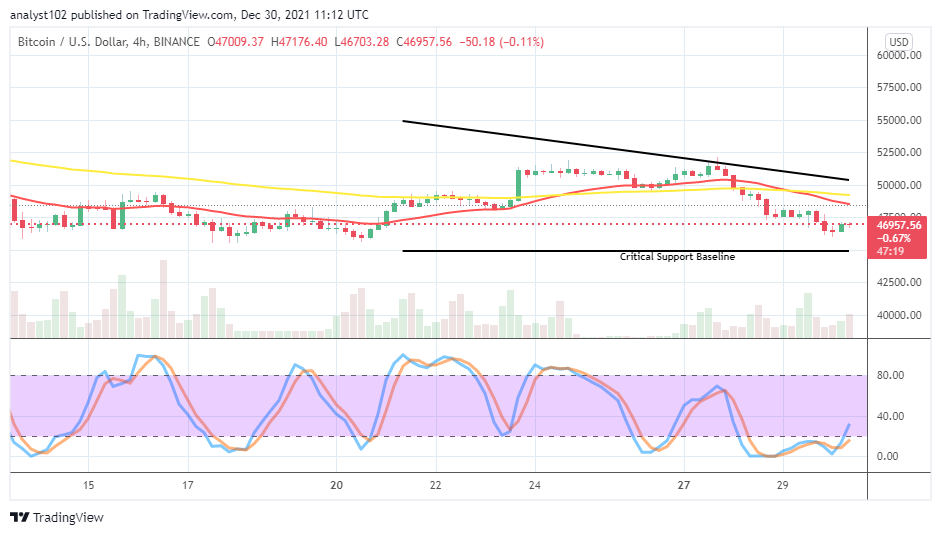
BTC/USD 4-hour Chart
The BTC/USD medium-term chart shows that the crypto’s price downsizes, approaching the $45,000 support level. The 14-day SMA indicator has intercepted the 50-day SMA indicator from the top to the downside. And they are in the levels of $50,000 and $47,500. A smaller 4-hour bullish candlestick has formed beneath the lower value line to indicate that an upswing attempted to signify a stop to the lately falling forces. The Stochastic Oscillators are in the oversold region, moving in a consolidation manner. And they have slightly crossed northbound against the range of 20 to give a promising-upward signal closely above the $45,000 critical support baseline.
Looking to buy or trade Bitcoin (BTC) now? Invest at eToro!
68% of retail investor accounts lose money when trading CFDs with this provider.
Read more:


