
Bitcoin (BTC/USD) Trade Hits Resistance, Averaging $50,000
Bitcoin Price Prediction – August 14
The BTC/USD trade hits resistance while trying to average a higher level close to $50,000 valuation. Yesterday’s session distinctively gives a clearer picture of the trading happenings as price now trades around the line of $47,031 at a negative percentage rate of about 2.60.
BTC/USD Market
Key Levels:
Resistance levels: $50,000, $52,500, $55,000
Support levels: $43,500, $41,000, $38,500
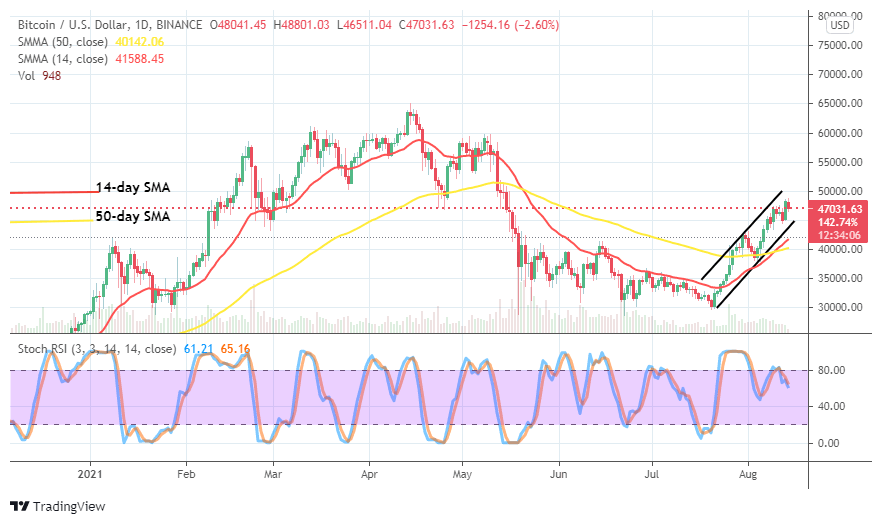
BTC/USD – Daily Chart
There has a sign of price reversion in the BTC/USD operation as the crypto trade hits resistance, trying to average $50,000 about a couple of several hours back. The bullish channel trend lines are intact, as all the trading activities still occur within the purview of the channel indicator drawn to monitor the pace at which the crypto economy is keeping. The 14-day SMA indicator has crossed the 50-day SMA indicator northward in a supportive motion beneath the lower bullish channel trend-line. The Stochastic Oscillators have crossed southward from the range of 80, pointing down around range 60. That indicates that some degrees of falling pressures are ongoing.
Should traders watch out for $45,000 and $50,000 lines as the BTC/USD trade hits resistance, averaging the higher value?
Traders needed to be on the lookout for trading activities around the points at $45,000 and $50,000 as the BCT/USD trade hits resistance while trying to average the latter higher value. The bullish channel trend lines that are drawn allow traders to know the trend that the price keeps. The current southward price movement could likely lead the market downward back to rebuild support around the former lower value mentioned earlier.
A forceful breakdown devoid of quick reversal motion against the line at $45,000 may result in letting more downs until sizeable sessions. However, going lower in valuation below $42,500 may not feature sustainably in the near time would it be that the BTC/USD market bears have come to re-hold their positions firm again. As a result, traders intending to launch short orders to be cautious of their decision.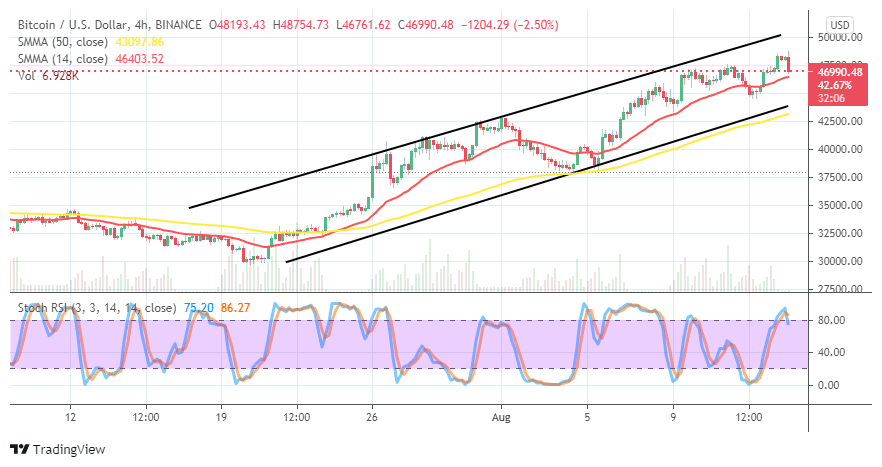
BTC/USD 4-hour Chart
It is more clarified on the BTC/USD 4-hour chart that the crypto trade hits resistance about a mid-point of $47,500 and $50,000 during today’s trading course. The bullish channel trend lines drew in the conferment of the crypto’s trading operations. The 14-day SMA indicator is between the channel trend lines, as the 50-day SMA indicator is closely underneath the lower bullish channel trend line. The Stochastic Oscillators have slightly crossed the lines southbound at range 80 to signify that the crypto market may potentially have to begin going down.
Looking to buy or trade Bitcoin (BTC) now? Invest at eToro!
75% of retail investor accounts lose money when trading CFDs with this provide.


