
Bitcoin Price Prediction: BTC/USD Breaks Above $55,000 Once Again

Bitcoin Price Prediction – October 9
The Bitcoin price is seen surging higher as the first digital asset is currently trading around the $54,807 resistance level.
BTC/USD Long-term Trend: Bullish (Daily Chart)
Key levels:
Resistance Levels: $60,000, $62,000, $64,000
Support Levels: $50,000, $48,000, $46,000
BTC/USD has been able to surpass $55,000 one more time as the coin is seen trading above the 9-day and 21-day moving averages. Now, the next important target may be at around $58,000, where Bitcoin has usually experienced heavy resistance from sellers. Thus, the Bitcoin (BTC) touches the daily high of $55,500 as the market opens today and it seems to be gaining some stability according to the daily chart.
Bitcoin Price Prediction: Would BTC Break Above $55,000 or Reverse?
The Bitcoin price is now trading around $54,807 as the coin keeps trading above the 9-day and 21-day moving averages. After several days of being traded between $52,000 and $55,000, Bitcoin has been able to clearly break above $55,000 and reach a price per coin of $55,500. The main question is whether it will be able to surpass $58,000 where it may usually find large resistance. Meanwhile, traders are now waiting for a continuation of the bull trend that would help Bitcoin reach new highs.
Moreover, for Bitcoin to would have reached $58,000, this could be the beginning of a new bull run in the crypto space. More so, as the technical indicator Relative Strength Index (14) is likely to move into the overbought region one more time, BTC/USD may hit the potential resistance levels at $60,000, $62,000, and $64,000 while sliding below the 9-day moving average could drag the price to the critical support levels of $50,000, $48,000, and $46,000 respectively.
BTC/USD Medium-term Trend: Ranging (4H Chart)
Looking at the 4-hour chart, BTC/USD is seen retreating after touching the daily high at $55,500. However, BTC/USD may cross below $54,500 as the technical indicator Relative Strength Index (14) moves below.
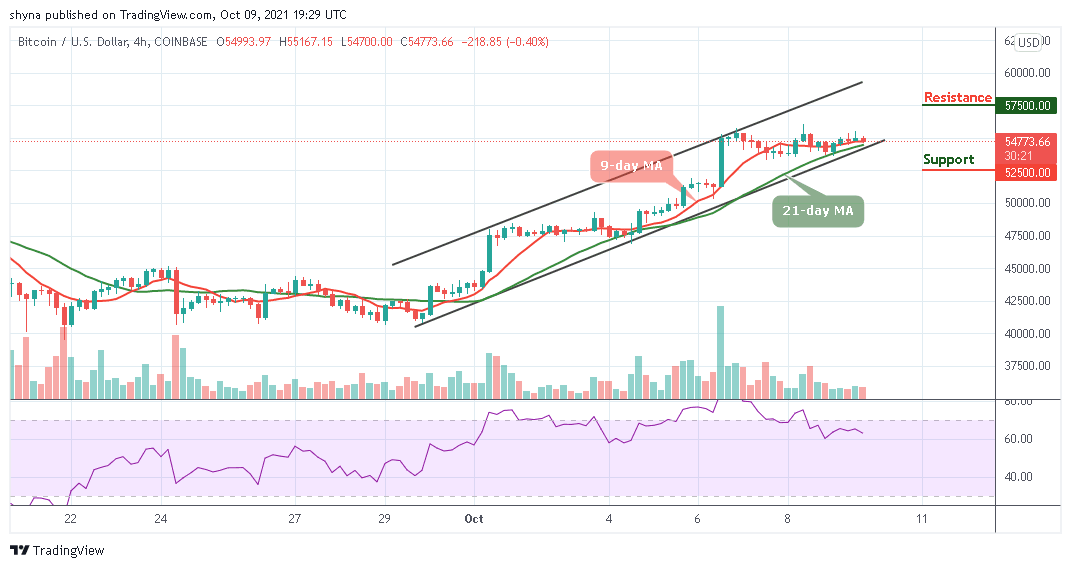
In other words, BTC/USD may likely take a downward move if the bulls failed to keep the coin above the 9-day and 21-day moving averages. However, the coin could cross below the lower boundary of the channel to reach the support level of $52,500 and below. More so, if bulls find a decent support around $54,500, the bulls may create another uptrend by moving towards the potential resistance at $57,500 and above.
Looking to buy or trade Bitcoin (BTC) now? Invest at eToro!
67% of retail investor accounts lose money when trading CFDs with this provider
Read more:


