
Bitcoin Price Prediction: BTC/USD Correcting Price to $44,500
Bitcoin Price Prediction – August 12
The Bitcoin price prediction is now experiencing the selling pressure as of late with the resistance found within the $46,223 level.
BTC/USD Long-term Trend: Bullish (Daily Chart)
Key levels:
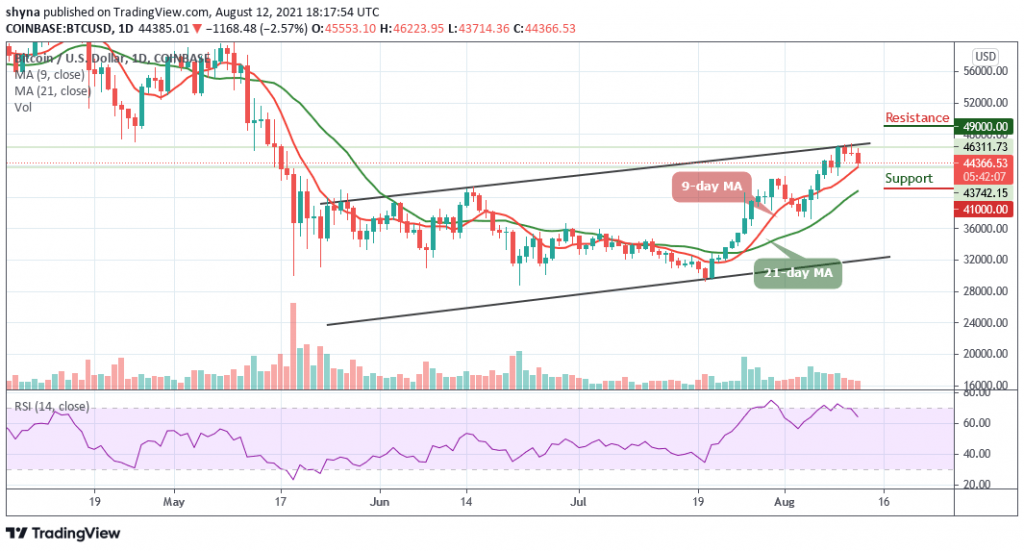
Resistance Levels: $49,000, $51,000, $53,000
Support Levels: $41,000, $39,000, $37,000
BTC/USD is now struggling to maintain its uptrend with the selling pressure found within the upper $46,000 region which is stopping it from seeing any major gains throughout the past few days. However, traders may not be surprised with the current selling pressure as bears are trying to defend against a break above the resistance level of $47,000. However, until bulls break above this level, the king coin may likely face a slight downward movement.
Bitcoin Price Prediction: The Bitcoin Price May Drop Slightly
At the time of writing, the Bitcoin price is trading down with a loss of 2.57% at its current price of $44,366. This marks a serious drop from its daily high of $46,223 set towards the upper boundary of the channel. However, the coming few days may likely bring the Bitcoin price below the 9-day moving average, and any decline or rise from this barrier could determine its next direction.
BTC/USD is currently retreating above the 9-day and 21-day moving averages, with the coin moving to erase the losses that came about at the early hour of today’s trading. However, any bullish movement above the upper boundary of the channel may push the price to the resistance level of $49,000, $51,000, and $53,000 while the supports are located at $41,000, $39,000, and $37,000 as the technical indicator, the Relative Strength Index (14) nosedives below 70-level.
BTC/USD Medium – Term Trend: Ranging (4H Chart)
Looking at the 4-hour chart, the resistance at the $46,000 has been too heavy for the bulls to overcome as the price may now follow a consolidation mode, which has made the cryptocurrency remain below the 9-day and 21-day moving averages as the resistance level is located at 47,000 and above.
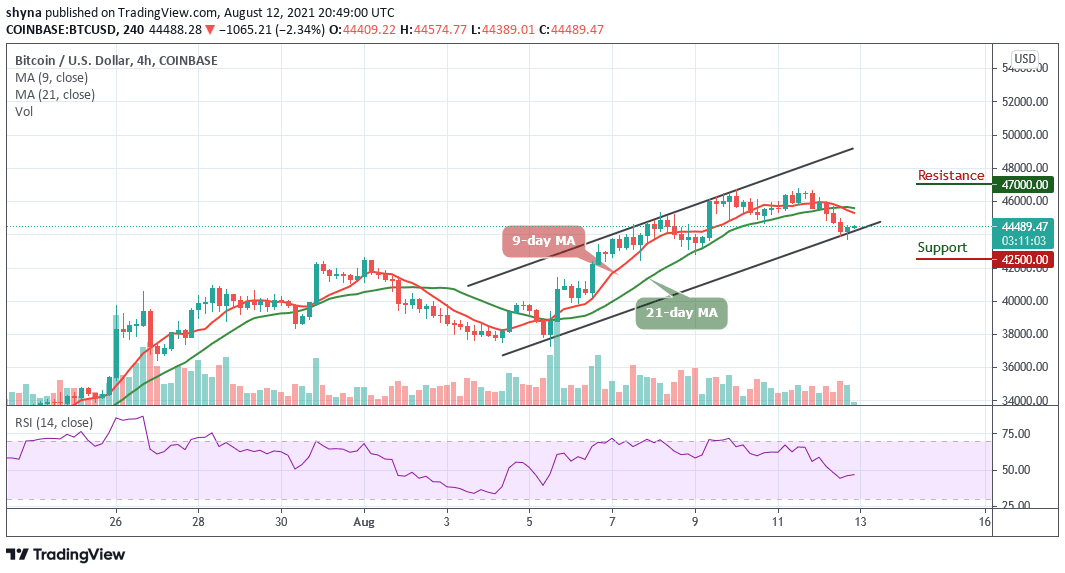
However, the Bitcoin price is still roaming around $44,489 as bears are pushing the price below the 9-day and 21-day moving averages. Meanwhile, the $42,500 and below may come into play if the technical indicator, Relative Strength Index (14) moves below 45-level.
Looking to buy or trade Bitcoin (BTC) now? Invest at eToro!
75% of retail investor accounts lose money when trading CFDs with this provider


