
Bitcoin Price Prediction: BTC/USD Couldn’t Trade Above $50,000

Bitcoin Price Prediction – December 15
The Bitcoin price prediction shows that BTC failed to continue higher as the king coin remains below $48,000 level.
BTC/USD Long-term Trend: Bearish (Daily Chart)
Key levels:
Resistance Levels: $53,000, $55,000, $57,000
Support Levels: $43,000, $41,000, $39,000
BTCUSD – Daily Chart
Looking to buy or trade Bitcoin (BTC) now? Invest at eToro!
68% of retail investor accounts lose money when trading CFDs with this provider
BTC/USD is currently trading below the 9-day moving average while a break below the lower boundary of the channel could bring the first digital asset back into the negative side. However, a key indicator is on the verge of breaking below the channel which could literally lead to more bearish movement.
Bitcoin Price Prediction: Would Bitcoin (BTC) Drop Below $45k?
At the time of writing, the Bitcoin price is seen retracing and trading under the 9-day and 21-day moving averages while the market price stays beneath as a sign of bearish momentum. However, a further increase in the bearish momentum may bring the price below the support level of $45,000; below it is another support at $44,000 before reaching the critical support of $43,000, $41,000, and $39,000 levels.
On the contrary, should the $47,000 level holds, the Bitcoin price may bounce back and face the resistance level of $49,000; therefore, further increase in the bulls’ pressure may push the price above the 9-day and 21-day moving averages and possibly hit the potential resistance levels at $53,000, $55,000, and $57,000. Meanwhile, the technical indicator Relative Strength Index (14) is moving below 40-level, crossing into the oversold region may ignite sell signals into the market, and breaking above the moving averages may cause the coin to resume the bullish movement.
BTC/USD Medium – Term Trend: Bearish (4H Chart)
When compares on the 4-hour chart, the 9-day moving average remains below the 21-day moving average as the Bitcoin price keeps trading below the moving averages. However, in case the king coin slides below the current market value of $47,482 level, the bears may exert pressure to break down the important support level and the price may decline to $45,000 and below.
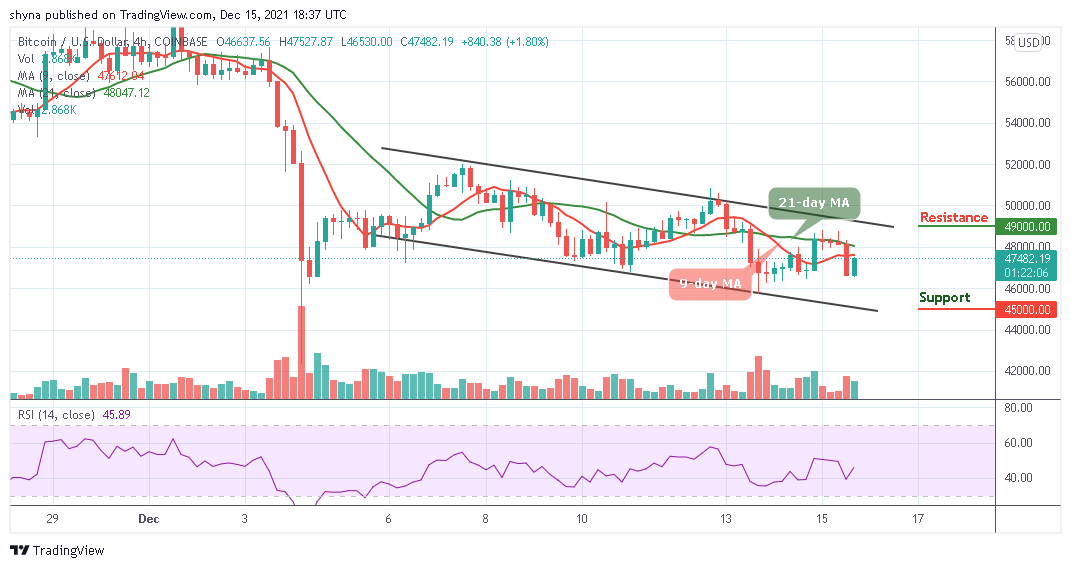
BTCUSD – 4 Hour Chart
Moreover, should the bulls increase their pressure and push the market price above the 9-day and 21-day moving averages, the resistance level of $48,500 may be penetrated and the price may increase to $49,000 and above. Meanwhile, the technical indicator Relative Strength Index (14) is moving above 40-level to indicate bullish movement while crossing below this level may suggest a bearish signal.
Looking to buy or trade Bitcoin (BTC) now? Invest at eToro!
68% of retail investor accounts lose money when trading CFDs with this provider
Read more:


