
Bitcoin Price Prediction: BTC/USD Falls Back Below $11,500 Following Rejection
Bitcoin Price Prediction – December 9
The Bitcoin price prediction now focuses on downtrends as the short-term crypto market uptrend seems over according to the daily chart.
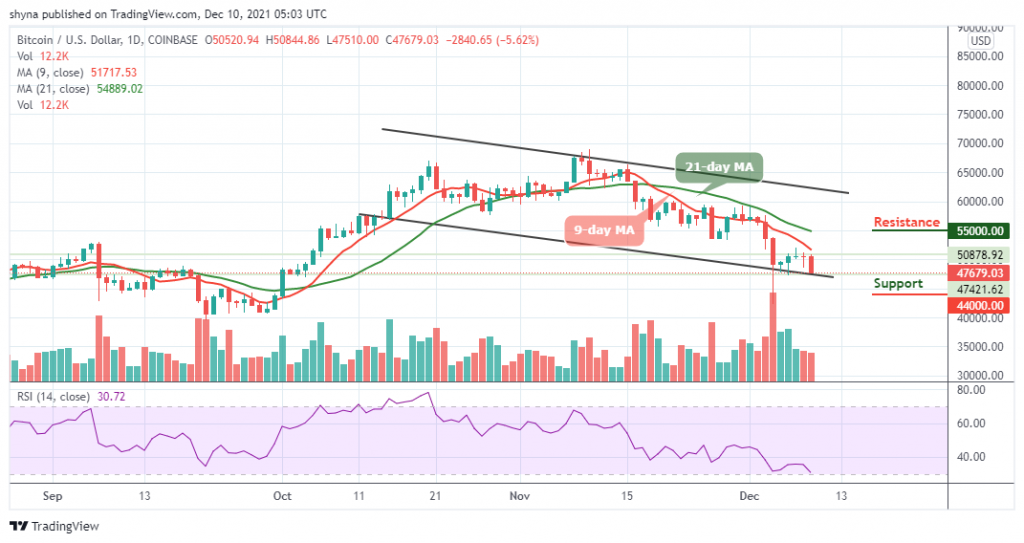
BTC/USD Long-term Trend: Bearish (Daily Chart)
Key levels:
Resistance Levels: $55,000, $57,000, $59,000
Support Levels: $44,000, $42,000, $40,000
BTC/USD falls below $50,500, prompting widespread crypto market profit-taking. The number-one crypto is just breaking below $48,000 at the time of writing, dragging the rest of the crypto market down with it. Is the crypto market heading towards another bull-run, and this is just another healthy and needed correction along the way to new highs? Or is this a major rejection back into the troughs of the bear market?
Bitcoin Price Prediction: Bitcoin (BTC) May Keep the Downtrends
At the time of writing, the Bitcoin price is seen heading towards the south as the coin ready to cross below the lower boundary of the channel. On the downside, the local support could be located around $46,000. Once it gives way, the new low at $45,000 may come into focus. Meanwhile, this barrier reinforced by the lower boundary of the channel is expected to slow down the sellers and trigger the recovery. Therefore, if BTC/USD struggles to climb above the 9-day and 21-day moving averages, there could be a bullish reaction.
However, initial support is near the $45,000 level below the channel. If there is another downside break below this support, the market price could even decline below the $44,000, $42,000, and $40,000 support levels as the technical indicator Relative Strength Index (14) nosedives to cross below 20-level. From the above, for a bullish reaction, BTC/USD needs to break above the moving averages to hit the resistance levels at $55,000, $57,000, and $59,000.
BTC/USD Medium-Term Trend: Bearish (4H Chart)
Looking at the 4-hour price chart, we can see that the bearish supply is becoming heavy in the market and the bulls couldn’t defend the $47,000 support. Meanwhile, the $44,000 support level and below may come into play if BTC breaks the mentioned support.
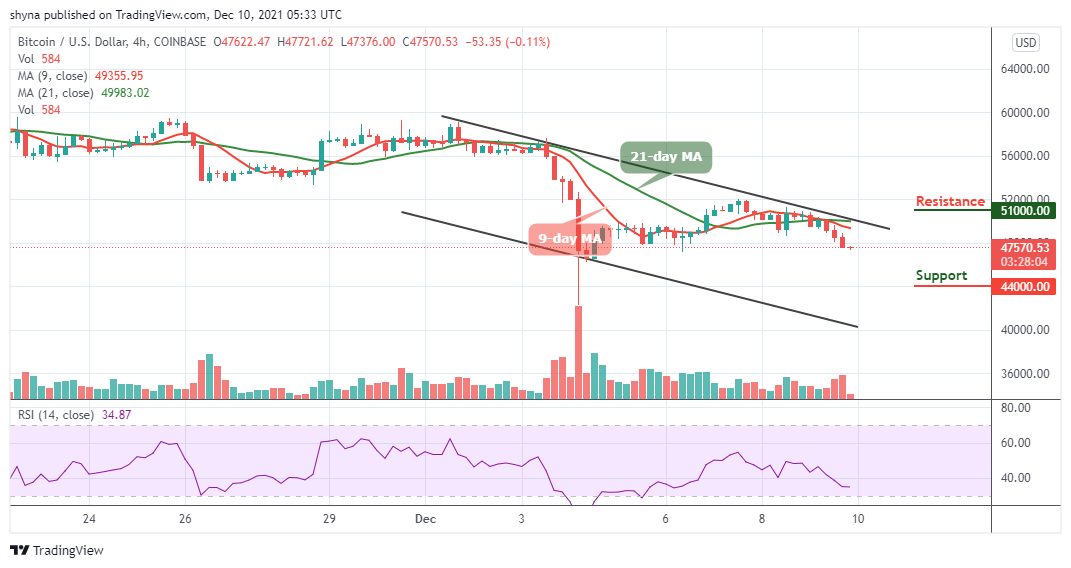
However, if the Bitcoin bulls can repower the market, traders can expect a retest of $11,600 resistance level. Therefore, breaking the mentioned resistance could also allow the bulls to test the $51,000 and above. However, the technical indicator Relative Strength Index (14) signal line free-falls to 34-level, suggesting bearish signals.
Looking to buy or trade Bitcoin (BTC) now? Invest at eToro!
68% of retail investor accounts lose money when trading CFDs with this provider
Read more:


