
Bitcoin Price Prediction: BTC/USD Gets Ready to Break Above $48,000

Bitcoin Price Prediction – December 19
The Bitcoin price prediction shows that BTC is getting ready to break above $48,000 while the king coin continues to enjoy the recent sharp uptrend.
BTC/USD Long-term Trend: Bearish (Daily Chart)
Key levels:
Resistance Levels: $52,000, $54,000, $56,000
Support Levels: $43,000, $41,000, $39,000
BTCUSD – Daily Chart
BTC/USD bulls are likely to break above the resistance level of $48,000; a move that would pave the way for gains above $50,000 but it’s unclear at the moment how long the crypto can keep this trend up. Moreover, the coin is currently settling above $47,000 while the further recovery is limited by the local resistance of $46,000. However, the recent dip that occurred in the past was actually helpful for Bitcoin as the technical indicator Relative Strength Index (14) moves to cross above 40-level.
Bitcoin Price Prediction: Would Bitcoin Begin to move Up?
The Bitcoin price continues to make an attempt in breaking above the 9-day and 21-day moving averages. However, looking at the daily chart, the bulls are likely to establish a higher high and only need to climb above $48,000 to confirm a daily uptrend. At the time of writing, the latest trend could be in the favor of the bulls and if the situation remains unchanged, the Bitcoin price may continue to move to the north.
Moreover, if the coin breaks above the moving averages, there is a chance that a new path to $52,000, $54,000, and $56,000 resistance levels may be created. For now, all the attention should go towards overcoming the hurdle at $48,000 and defending support at $46,000. Meanwhile, going below $45,000 may likely seek supports at $43,000, $41,000, and $39,000 respectively.
BTC/USD Medium-Term Trend: Bearish (4H Chart)
On the 4-hour chart, there are several important technical barriers below and above the current price at the $47,250 level. This means that BTC/USD may spend enough time consolidating gains at the current levels as the technical indicator, the Relative Strength Index (14) moves sideways.
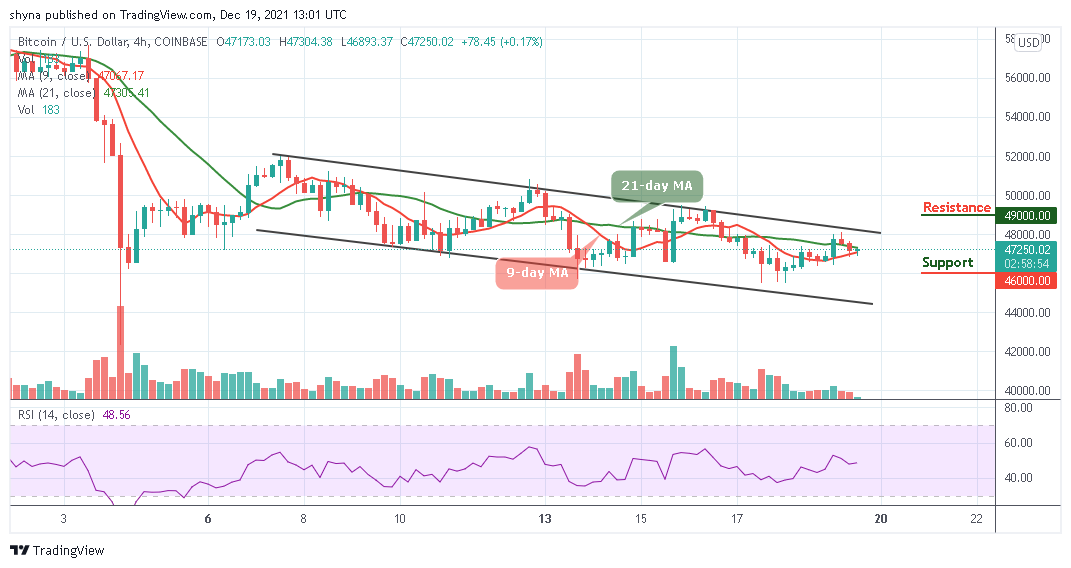
BTCUSD – 4 Hour Chart
Meanwhile, in the long run, the trend stays range-bounding as long as the price is above $47,000. The potential resistance level is located at $49,000 and above while the nearest support is under the 9-day and 21-day moving averages at $46,000 and below.
Looking to buy or trade Bitcoin (BTC) now? Invest at eToro!
68% of retail investor accounts lose money when trading CFDs with this provider
Read more:


