
Bitcoin Price Prediction: BTC/USD May Consolidate Around $48,000

Bitcoin Price Prediction – December 22
Today, the Bitcoin price loses traction after hitting $49,595; losses likely to continue in the near term.
BTC/USD Long-term Trend: Bearish (Daily Chart)
Key levels:
Resistance Levels: $54,000, $56,000, $58,000
Support Levels: $45,000, $43,000, $41,000
BTCUSD – Daily Chart
Looking at the daily chart, it can be easily seen that the market is likely to come back in the red zone as BTC/USD is posting minor losses of 0.17% on the day after commencing the trading at $48,914. It has an intraday high of $49,595; although the world’s largest crypto touches the support level of $48,450 before going back to where it is currently trading at $48,831.
Bitcoin Price Prediction: What Could be the Next Direction for BTC/USD?
According to the daily chart, the Bitcoin price is making an attempt to plunge below $48,000 one more time, marking $48,450 as the current daily low at the moment. Does this mean that Bitcoin (BTC) could not touch the vital resistance level of $50,000 and searching for a new low? Looking at the declining daily volume candle, together with the steady but stable recent Bitcoin price action, it can be assumed that a stronger move may be coming into the market soon.
At the time of writing, BTC/USD is struggling to maintain the $48,800 level as the coin could follow sideways movement as the technical indicator Relative Strength Index (14) may move in the same direction above 40-level, the next supports may likely come at $45,000, $43,000 and $41,000. From the upside, by keeping the Bitcoin price above the 9-day and 21-day moving averages, any bullish movement could go towards the upper boundary of the ascending channel to hit the resistance levels of $54,000, $56,000, and $58,000 which will be very close to the channel.
BTC/USD Medium-Term Trend: Ranging (4H Chart)
On the 4-Hour chart, BTC price hovers below the 9-day moving average around $48,800 which may take time to persistently trade above $49,000. However, if the bulls gather enough strength and regroup, the king coin may likely hit the resistance level of $50,000 and above.
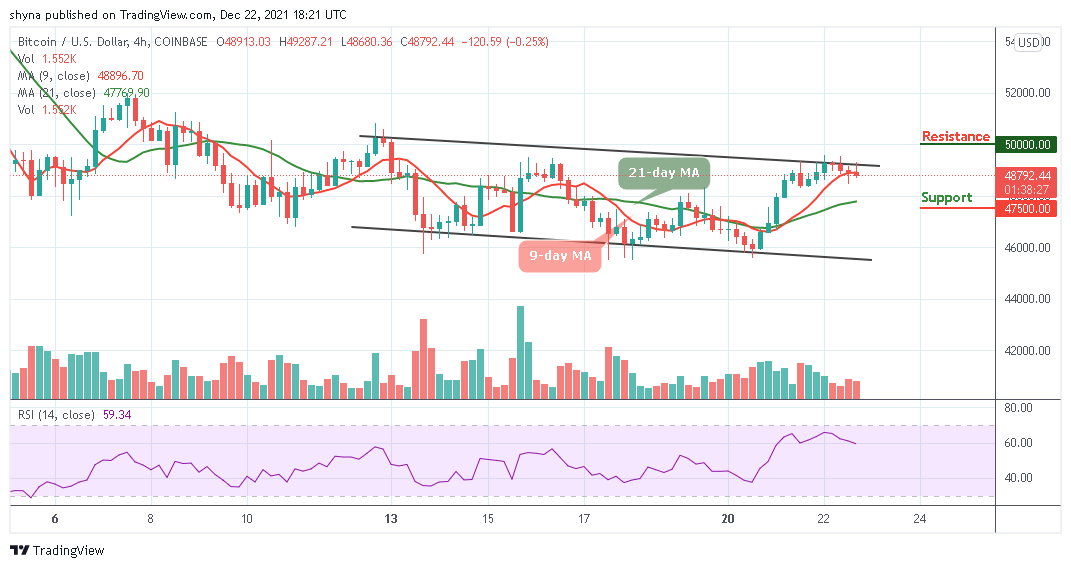
BTCUSD – 4 Hour Chart
However, on the downside, immediate support could be located below the 9-day moving average. The price may likely fall below $48,000 if the bears step back into the market, a further movement could reach the critical support at $47,500 and below. At the moment, BTC/USD is still moving in sideways while the Relative Strength Index (14) moves to cross below 60-level, indicating an indecisive in the market movement.
Looking to buy or trade Bitcoin (BTC) now? Invest at eToro!
68% of retail investor accounts lose money when trading CFDs with this provider
Read more:


