
Bitcoin Price Prediction: BTC/USD Price Still Consolidating Around $50,500
Bitcoin Price Prediction – December 8
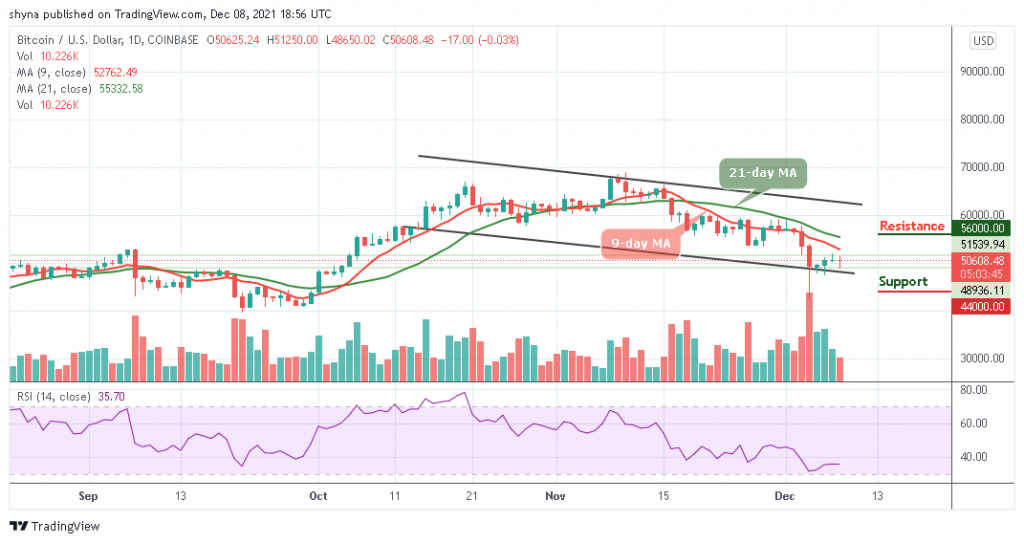
The Bitcoin price prediction continues sideways movement currently at $50,608 after another significant rejection from $51,250.
BTC/USD Long-term Trend: Ranging (Daily Chart)
Key levels:
Resistance Levels: $56,000, $58,000, $60,000
Support Levels: $44,000, $42,000, $40,000
Looking at the daily chart, after serious downtrend, BTC/USD is still flat and trading sideways but has seen a volatile move, peaking at around $51,250 before quickly dropping to $50,608.48 below the 9-day and 21-day moving averages. Therefore, one can say that the Bitcoin (BTC) price is likely to continue with sideways movement before dropping below the channel.
Bitcoin Price Prediction: What could be the Next Direction for Bitcoin?
According to the daily chart, the Bitcoin price is trading at $50,608 with a slight loss of 0.03%. However, the prevailing trend is ranging from expanding volatility as the first digital asset continues to consolidate in a bearish flag pattern. Meanwhile, a breakdown from this pattern is supposed to continue in the direction of the previous trend. On the contrary, traders expect BTC/USD to rise above the 9-day moving average before moving towards the potential resistance levels at $56,000, $58,000, and $60,000.
Furthermore, should Bitcoin price breaks below the lower boundary of the channel; the price may head towards the $48,000 vital support. A further low drive could send the price to $44,000, $42,000, and $40,000 support. The technical indicator Relative Strength Index (14) is seen moving sideways, which makes the market to be indecisive at the moment.
BTC/USD Medium – Term Trend: Ranging (4H Chart)
On the 4-hour chart, we can see that the bears are likely to step back into the market, trading around the 9-day moving averages. Meanwhile, the $48,000 and below may be visited if BTC/USD breaks below the 21-day moving average.
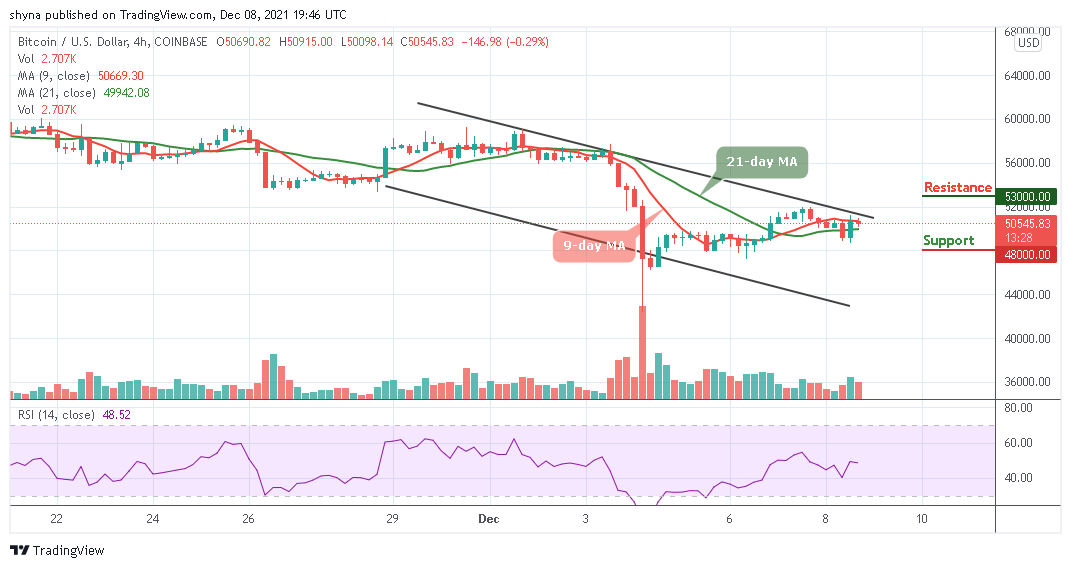
However, if the buyers can push the market to the north, traders may expect a break above the upper boundary of the channel. Breaking the mentioned barrier may further allow the bulls to touch the resistance level of $53,000 and above but the technical indicator Relative Strength Index (14) is moving below 50-level, indicating another bearish signal.
Looking to buy or trade Bitcoin (BTC) now? Invest at eToro!
68% of retail investor accounts lose money when trading CFDs with this provider
Read more:


