
Bitcoin Price Prediction: BTC/USD Ready to Break $48,000
Bitcoin Price Prediction – August 25
The Bitcoin price bounces off the support at $47,122 and added more than $1500 to its current value.
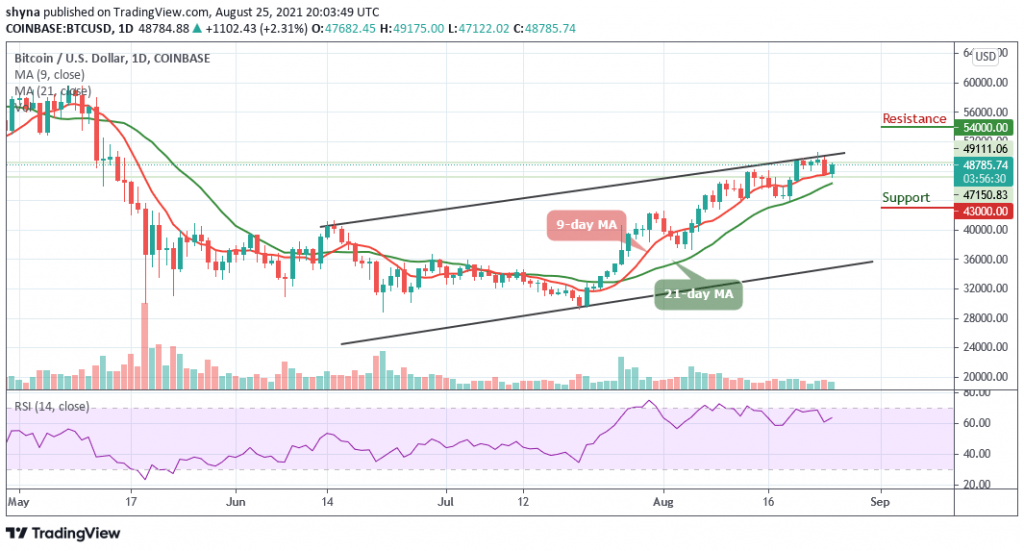
BTC/USD Long-term Trend: Bullish (Daily Chart)
Key levels:
Resistance Levels: $54,000, $56,000, $58,000
Support Levels: $43,000, $41,000, $39,000
BTC/USD is currently trading around $48,785 with a 2.31% gain after touching the daily low of $47,122 support. According to the daily chart, traders can see that the Bitcoin price is fighting to stay above the important level of $48,000 as it crosses above the upper boundary of the channel. However, for BTC/USD to remain above this barrier for the next few days, the bulls may need to make the $47,000 support level to be pretty strong.
Bitcoin Price Prediction: Bitcoin (BTC) Bulls Rally Still On
The Bitcoin price has been maintaining little upward movement, and if the first digital asset stays above the 9-day moving average, it could touch the nearest resistance level of $50,000. Moreover, the Bitcoin price may need to reclaim this important resistance level to head upwards. If successful, the primary cryptocurrency could therefore aim at $51,000, followed by $52,000, and $53,000 resistance levels.
However, the technical indicator Relative Strength Index (14) is currently above 60-level, therefore, one may conclude that BTC/USD is done with the downside. However, recovery may not come easy and traders must be aware that support will have to be sort above $48,000 while other important zones to keep in mind are around $54,000, $56,000, and $58,000 resistance levels.
Furthermore, despite the current movement, the RSI (14) is yet to cross into the overbought region which means that there may still be a room that could be explored by the bears. If this happens, the supports at $43,000, $41,000, and $39,000 may play out.
BTC/USD Medium – Term Trend: Bullish (4H Chart)
From a technical point of view, on the 4-hour chart, the technical indicator Relative Strength Index (14) keeps moving upward and ready to cross above 50-level. Therefore, for this scenario to come to focus, there must be a little bit of bullish divergence on the technical indicator while the signal line faces the north.
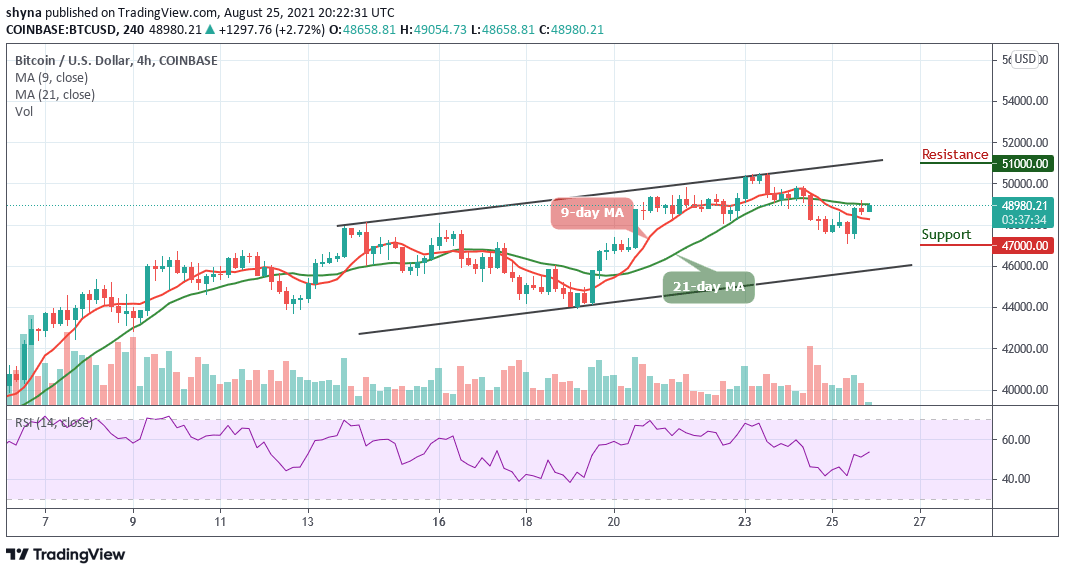
However, if the Bitcoin price breaks above the 21-day moving average, the market price may likely reach the resistance at $51,000 and above. On the other hand, if the current market value drops below the 9-day MA, it may likely touch the support level of $47,000 and below.
Looking to buy or trade Bitcoin (BTC) now? Invest at eToro!
75% of retail investor accounts lose money when trading CFDs with this provider


