
Bitcoin Price Prediction: BTC/USD Rebounds from $46,544 Support
Bitcoin Price Prediction – March 30
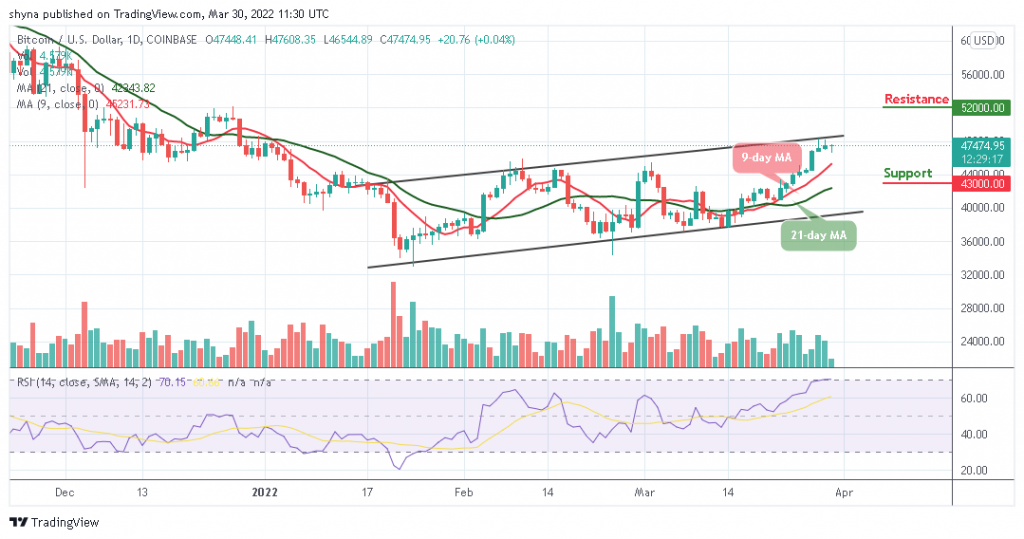
According to the daily chart, the Bitcoin price prediction shows that BTC is making a come-back after retreating below $47,000.
BTC/USD Long-term Trend: Ranging (Daily Chart)
Key levels:
Resistance Levels: $52,000, $54,000, $56,000
Support Levels: $43,000, $41,000, $39,000
At the time of writing, BTC/USD is teetering at $47,474. There have been instances when BTC has exchanged hands above $48,000 sustaining the bullish price action is an uphill task. Moreover, the king coin is moving towards the upper boundary of the channel as the king coin remains above the 9-day and 21-day moving averages.
Bitcoin Price Prediction: Bitcoin May Either Go up or Down
According to the daily chart, if the support level of $46,500 gives way to the daily chart, even $46,000 may not be held as support. Therefore, after a pit stop at the support highlighted towards the 9-day moving average. According to the technical indicator Relative Strength Index (14), the Bitcoin price prediction is not yet ready for a downward movement.
However, as the king coin moves to cross above the upper boundary of the channel, any bullish movement above this barrier is likely to locate the resistance levels at $52,000, $54,000, and $56,000. In other words, if the market falls sharply to cross below the 9-day moving average, the critical supports will come at $43,000, $41,000, and $39,000 while the technical indicator Relative Strength Index (14) moves into the overbought region.
BTC/USD Medium-Term Trend: Bullish (4H Chart)
Looking at the 4-hour chart, BTC/USD is moving sideways below the 9-day moving averages. During the European session today, the king coin touches the daily high at $47,608 before dropping to where it is currently changing hands at $47,233. On the downside, traders can only be sure of one healthy support at $46,000. Further support could be located around $45,500 and below.
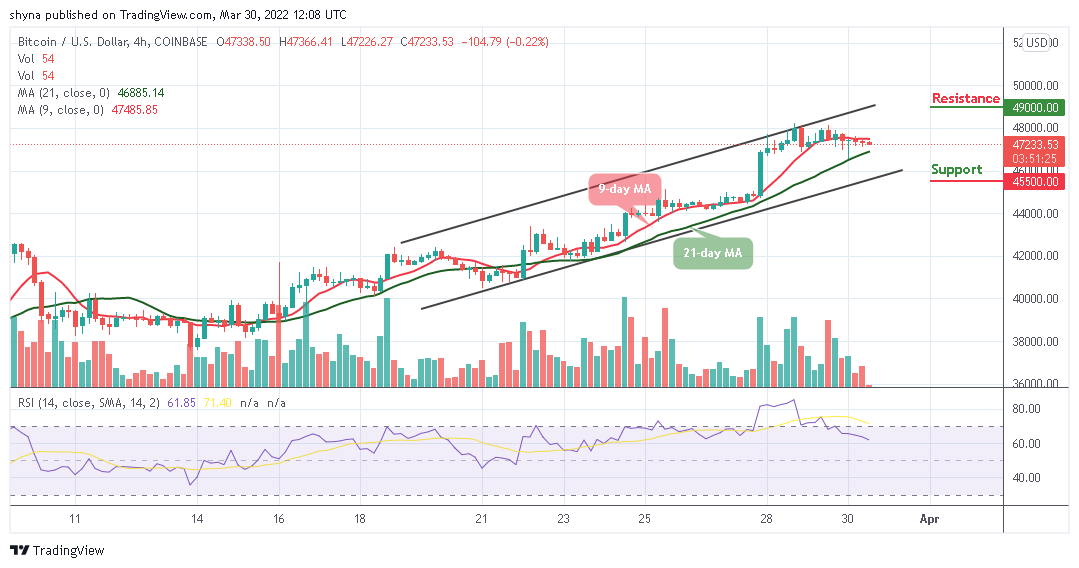
Nevertheless, the technical indicator Relative Strength Index (14) is moving to cross below the 60-level. Therefore, the Bitcoin price is not yet ready for the bullish movement but should in case the market price crosses above the 9-day MA; further bullish movements could push the price towards the potential resistance level of $49,000 and above.
Looking to buy or trade Bitcoin (BTC) now? Invest at eToro!
68% of retail investor accounts lose money when trading CFDs with this provider
Read more:


