
Bitcoin Price Prediction: BTC/USD Remains Above $40,000
Bitcoin Price Prediction – July 28
The Bitcoin (BTC) is recovering from the recent low of $38,803 but bulls may have trouble taking the market price above $41,000.
BTC/USD Long-term Trend: Bearish (Daily Chart)
Key levels:
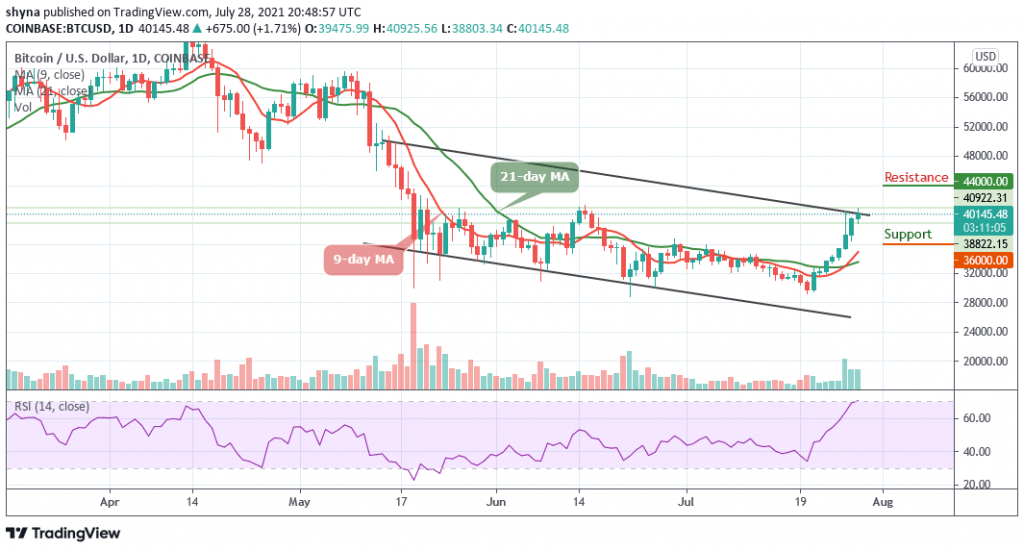
Resistance Levels: $44,000, $46,000, $48,000
Support Levels: $36,000, $34,000, $32,000
At the time of writing, BTC/USD is trading up by 1.71% at its current price of $40,145. This is the spot where the coin has traded a couple of days ago, with the buying pressure seen in the $40,500 region proving significant. Moreover, where the coin may go next could depend on whether or not bulls can break above the upper boundary of the channel.
Bitcoin Price Prediction: Bitcoin (BTC) May Accelerates Above $40?
As the Bitcoin price touches the daily high of $40,925, it is important for bulls to remains around this level, otherwise, there may come a bearish breakdown when BTC/USD falls below the channel. The 9-day MA is crossing above the 21-day MA as the technical indicator Relative Strength Index (14) is sending a moderate sign which is more likely a bullish trend at the time of the outcome.
However, BTC/USD will confirm more bullish trends if the market price moves above the previous high of $40,925. On the contrary, the Bitcoin price may follow the bearish trend if the price moves below the 9-day and 21-day moving averages. Once this is done, the king coin may retest the supports of $36,000, $34,000, and $32,000 while the RSI (14) moves into the overbought region. Therefore, a strong bullish spike may push the price towards the resistance levels of $44,000, $46,000, and $48,000.
BTC/USD Medium-Term Trend: Bullish (4H Chart)
According to the 4-hour chart, the Bitcoin price touches the daily high at $40,925. However, today’s price move happens to be the most impressive one as it climbs above the long-awaited resistance level of $40,000 with a sharp upsurge. More so, BTC/USD is now retreating below $40,000 as the RSI (14) moves below 65-level.
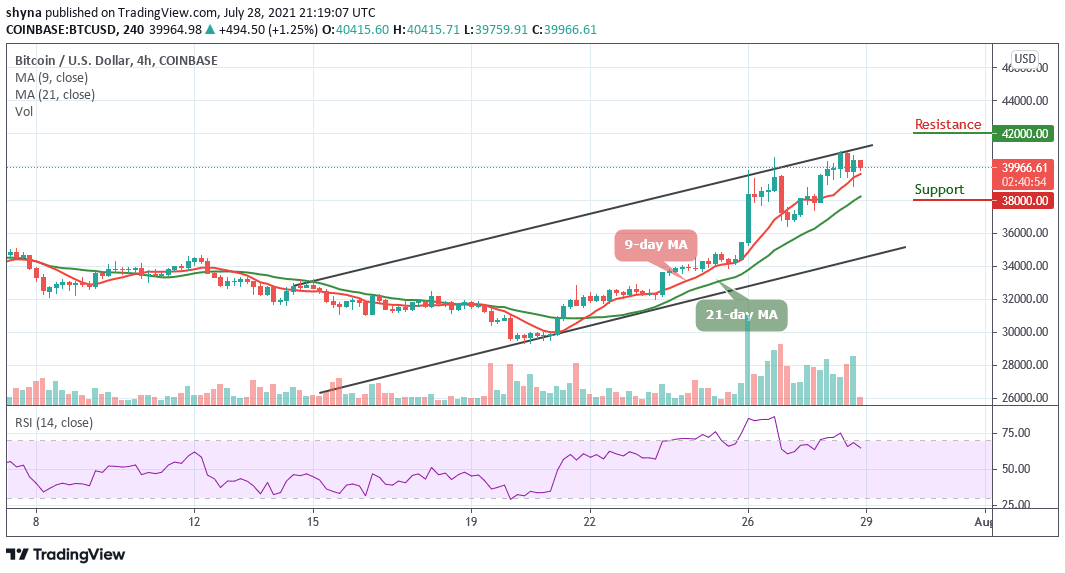
However, BTC may take a downward move if the price crosses below the 9-day moving average. Therefore, the coin may breach below the 21-day moving average and could reach another support at $38,000 and below. Nevertheless, if the bulls find a decent resistance level of around $41,000, the coin may continue bullish movement above the channel at the resistance level of $42,000 and above.
Looking to buy or trade Bitcoin (BTC) now? Invest at eToro!
75% of retail investor accounts lose money when trading CFDs with this provider


