
Bitcoin Price Prediction: BTC/USD Retreat May Be Necessary for a Recovery to $65,000

Bitcoin Price Prediction – October 16
The Bitcoin price rests above $60,500 after the retreat from levels $60,139 as further downside momentum appears to be imminent.
BTC/USD Long-term Trend: Bullish (Daily Chart)
Key levels:
Resistance Levels: $69,000, $71,000, $73,000
Support Levels: $54,000, $52,000, $50,000
BTC/USD is currently hovering at $61,049 after losing 1.05% of its value today. More so, where Bitcoin will go next after the impressive rally this week is likely to depend on the ability of the bulls to hold the price above the key support at $60,000 above the 9-day and 21-day moving averages.
Bitcoin Price Prediction: Bitcoin (BTC) May Drop to Rise
At the time of writing, the Bitcoin price is still heading to the south as the coin remains above the 9-day and 21-day moving averages. Nevertheless, a further retracement seems imminent and it is likely to break below 9-day moving average. Meanwhile, looking at the chart, $54,000, $52,000, and $50,000 serve as the major support levels, making room for BTC to fall even further.
Moreover, the technical indicator Relative Strength Index is likely to drop from the overbought region, suggesting a slightly bearish movement. However, as the daily chart reveals, if the bulls resume back into the market and push the Bitcoin price above the upper boundary of the channel, BTC/USD may see resistance level at $65,000, any further movement could send it to the potential resistance levels of $69,000, $71,000, and $73,000 respectively as the technical levels remain positive.
BTC/USD Medium-Term Trend: Bullish (4H Chart)
Looking at the 4-hour chart, the bears are making efforts to step back into the market but the bulls are holding the nearest support by picking the price from $60,139 to where it is currently trading at $60,828 which is below the 9-day moving average. Meanwhile, the $64,000 and above may come into play if BTC/USD moves toward the upper boundary of the channel.
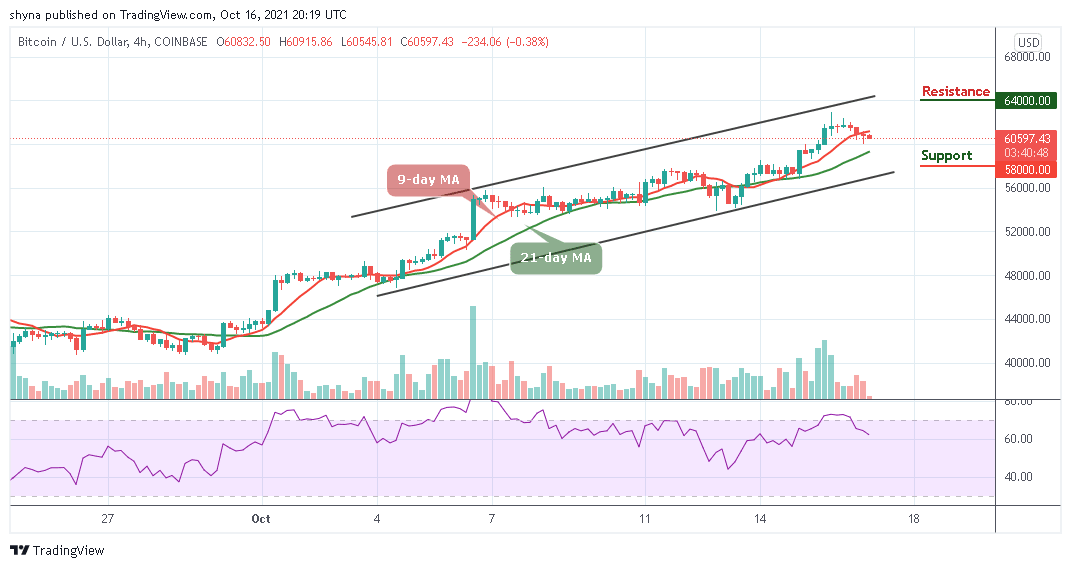
However, if the price breaks below the 21-day moving average of the ascending channel and begin to fall, the support level of $58,000 and below may come to focus. Meanwhile, as the Relative Strength Index (14) moves to cross below 60-level, more bearish signals may play out before a reversal could come in.
Looking to buy or trade Bitcoin (BTC) now? Invest at eToro!
67% of retail investor accounts lose money when trading CFDs with this provider
Read more:


