
Bitcoin Price Prediction: BTC/USD Stalls Below $50,000

Bitcoin Price Prediction – December 5
The Bitcoin price prediction reveals that BTC remains below the 9-day and 21-day moving averages as the coin stumbles again.
BTC/USD Long-term Trend: Bearish (Daily Chart)
Key levels:
Resistance Levels: $56,000, $58,000, $60,000
Support Levels: $42,000, $40,000, $38,000
BTC/USD is now struggling to maintain its position above $49,000 and its price dives below the $48,000 level today to touch the daily low at $47,827. The Bitcoin price is in a dangerous position as the price slipped below the lower boundary of the yesterday. If the same breakdown occurred again, the downside momentum may gain traction with the next focus on $45,000 support. At the time of writing, Bitcoin is trading near the lower boundary of the channel at $48,496 with a decline of 1.52% on the daily price chart.
Bitcoin Price Prediction: Bitcoin (BTC) May Crash More
If the Bitcoin price refuse to recover the recent losses and push the coin to the higher levels, the market price may likely head to the south to touch the next critical support level around $45,000. However, the market may experience a lot of short-term based trades and a lot of volatility too as the technical indicator Relative Strength Index (14) gets ready to cross into the oversold region.
Meanwhile, it is important to note that the Bitcoin price is most likely to break south in as much as the 9-day MA remains below the 21-day MA, and its failure to hold the mid-range support level may pull the price down to its next support level at $43,000. Therefore, the short-term analysis indicates that BTC/USD may test lower levels with key support levels at $42,000, $40,000, and $38,000 while the resistance levels could be located at $56,000, $58,000, and $60,000.
BTC/USD Medium – Term Trend: Ranging (4H Chart)
According to the 4-hour chart, BTC/USD has been facing immense turbulence throughout the past few days, with sellers forcing its price down to the lows of $47,977. If bulls decide to push the market price above the 9-day moving average, the coin may likely hit the resistance at $53,000 and above.
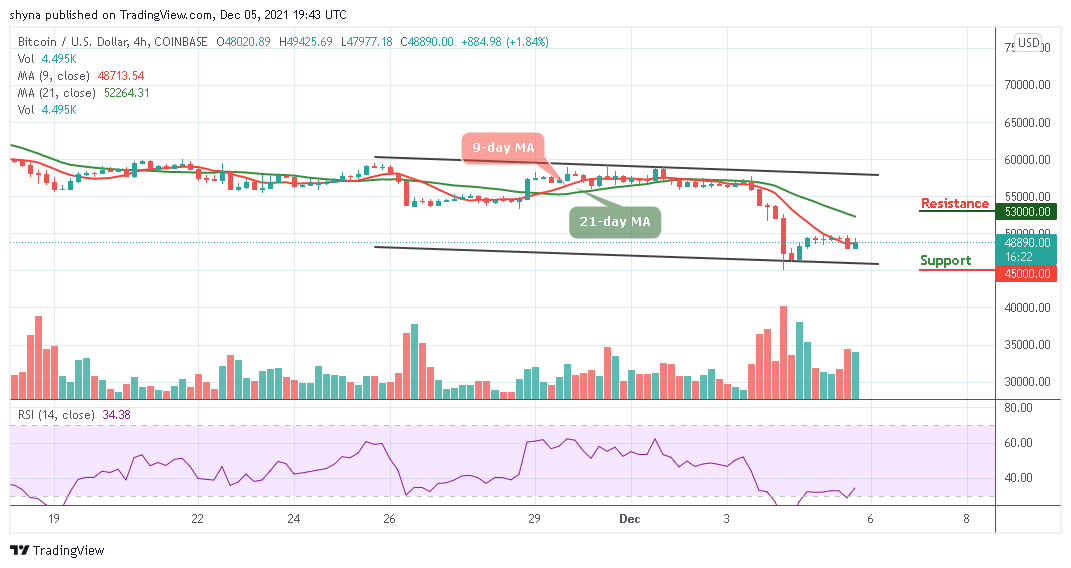
However, the technical indicator reveals that the king coin may be ready for further upside if the Relative Strength Index (14) crosses above 40-level. Therefore, any reversal below the lower boundary of the channel may locate the critical support at $45,000 and below.
Looking to buy or trade Bitcoin (BTC) now? Invest at eToro!
68% of retail investor accounts lose money when trading CFDs with this provider
Read more:


