
Bitcoin Price Prediction: BTC/USD Stays around $63,000 Level

Bitcoin Price Prediction – November 3
The Bitcoin price prediction continues to follow the sideways movement as the price continues to trade around the resistance level of $63,000.
BTC/USD Long-term Trend: Ranging (Daily Chart)
Key levels:
Resistance Levels: $70,000, $72,000, $74,000
Support Levels: $55,000, $53,000, $51,000
BTC/USD is likely to experience another unexpected selloff if the market price crosses below the 9-day and 21-day moving averages. Today, the Bitcoin price drops slightly to touch the support of $62,787 after touching the daily high of $63,568. However, a reversal could play out if the king coin trades above the moving averages, and this may send BTC/USD above the opening price of $63,266 level.
Bitcoin Price Prediction: Bitcoin Price Not Yet Ready for the Upward Move
At the moment, the technical indicator Relative Strength Index (14) reveals that the Bitcoin price is consolidating above 60-level and any drop below this level could lead the first digital asset to cross below the 9-day and 21-day moving averages. However, the technical indicator Relative Strength index (14) may follow the upside as the signal line could make a quick turn towards 65-level.
On the upside, recovery may not come now but any attempt to move towards the upper boundary of the channel which could hit the resistance levels of $70,000, $72,000, and $74,000 respectively. On the other hand, any bearish movement below the 9-day and 21-day moving averages could force the Bitcoin price to follow a painful path towards the support levels of $55,000, $53,000, and $51,000.
BTC/USD Medium-Term Trend: Ranging (4H Chart)
Looking at the 4-hour chart, the Bitcoin price is seen hovering below the 9-day and 21-day moving averages. The chart reveals that the coin touches the support level of $61,665 as the market prepares for more downtrends by staying below the moving averages. More so, BTC/USD is likely to follow the bearish movement if the coin faces the lower boundary of the channel. Therefore, critical support could be located at $60,000 and below.
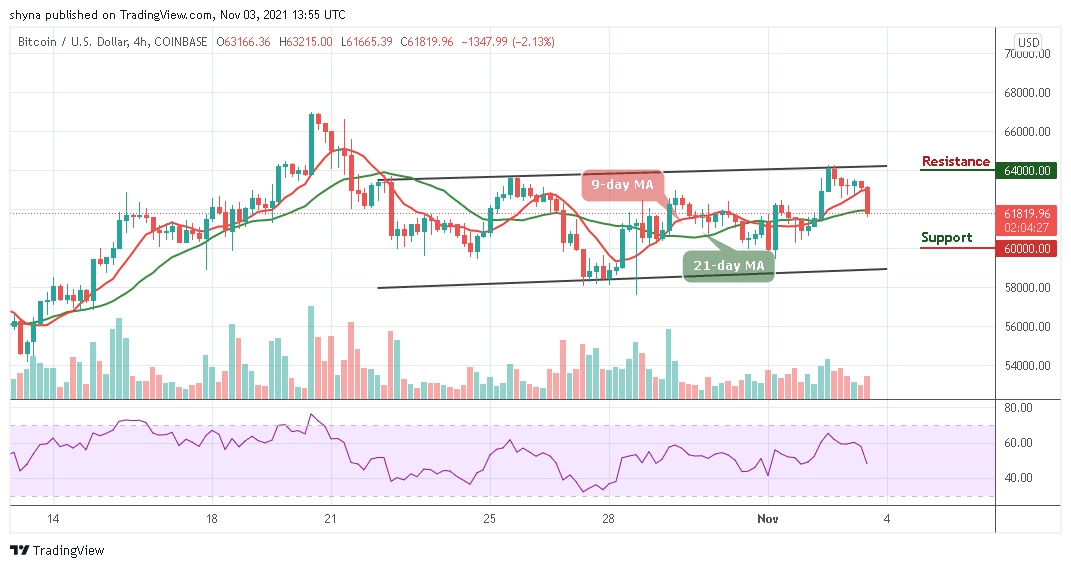
Moreover, if the price bounce back above the 9-day and 21-day moving averages and cross above the upper boundary of the channel, the Bitcoin price may likely reach the resistance level of $64,000 and above. With the look of things, as the technical indicator Relative Strength Index (14) crosses below 50-level, the king coin is likely to visit more downtrends but if the price breaks above the channel, BTC/USD may follow the upward movement.
Looking to buy or trade Bitcoin (BTC) now? Invest at eToro!
68% of retail investor accounts lose money when trading CFDs with this provider
Read more:


