
Ripple Price Prediction: XRP/USD Touches $1.15 Level after Correcting Low

Ripple Price Prediction – October 14
The Ripple price prediction shows that XRP/USD is currently facing the north as the coin stays above the 9-day moving average.
XRP/USD Market
Key Levels:
Resistance levels: $1.35, $1.40, $1.45
Support levels: $0.90, $0.85, $0.80
XRP/USD bulls are coming into play as the price crosses above the red-line of the 9-day moving average, rising from $1.10 to touch the daily high at $1.15. However, the technical indicator Relative Strength Index (14) is likely to cross above 60-level which shows that the daily trend is still bullish as the overall market sentiment may likely move sideways.
Ripple Price Prediction: Would Ripple (XRP) Stay at the Upside?
At the time of writing, the Ripple price is hovering around $1.14 after touching the high of $1.15. According to the daily chart, a building bullish momentum suggests that XRP/USD may continue to scale the levels towards $1.20 important resistance but from a technical point of view, the Ripple price is likely to move sideways as observed by the technical indicator. Meanwhile, as the RSI (14) moves to cross above 60-level, the bullish grip may continue to strengthen.
Moreover, the nearest resistance for the market can be located at $1.35, $1.40, and $1.45 levels. Meanwhile, as said earlier, there’s a sign of a decisive move that may come to play in the market soonest. However, if the daily low of $1.10 support gets weak, a price break-down below the 21-day moving average may occur as the bears could find additional low at $0.90, $0.85, and $0.80 support levels.
When compares with Bitcoin, the Ripple price continue to move down as the red-line of the 9-day moving average stays below the green-line of the 21-day moving average. Meanwhile, if the buyers failed to push the market price above the 9-day MA, XRP/BTC may cross below the lower boundary of the channel to hit the critical support level at 1700 SAT and below.
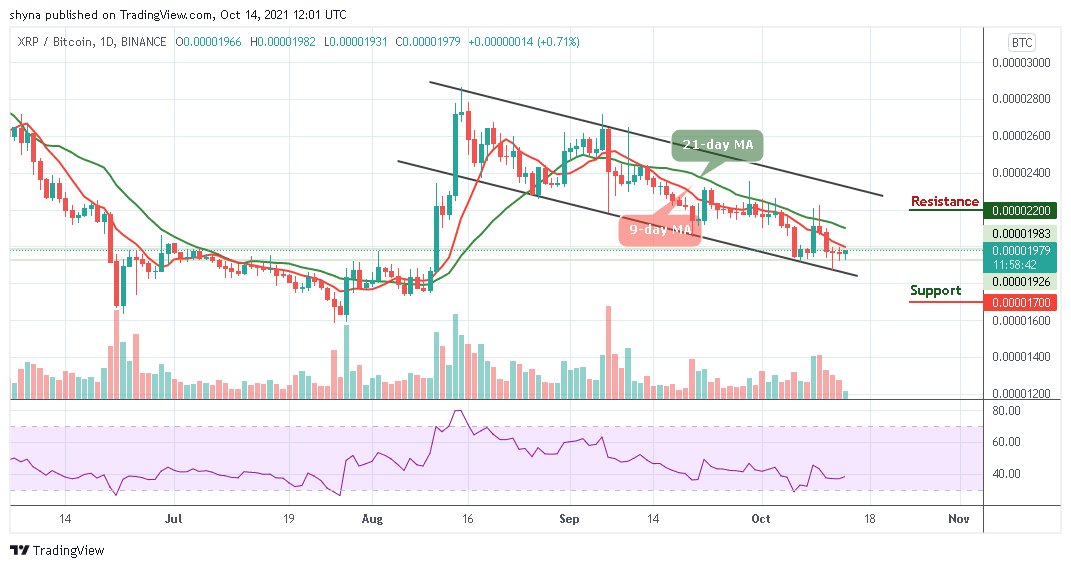
Therefore, if the bulls make a successful cross above the 9-day and 21-day moving averages, then the Ripple price may experience a bullish movement and the nearest resistance level is located at 2200 SAT and above. Meanwhile, the technical indicator Relative Strength Index (14) is likely to cross above 40-level, which indicates slight bullish movement.
Looking to buy or trade Ripple (XRP) now? Invest at eToro!
67% of retail investor accounts lose money when trading CFDs with this provider


